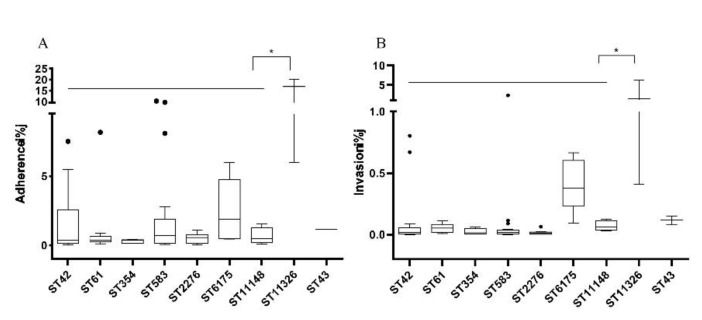
Figure 3.
The adherence (A) and invasion (B) rates of isolates of different STs. The point (•) out of boxes indicates moderated outliers, the line in boxes represents mean value of the STs, the asterisk (*) represents a statistically significant difference (p < 0.05) between STs and the adherence or invasion rate.

