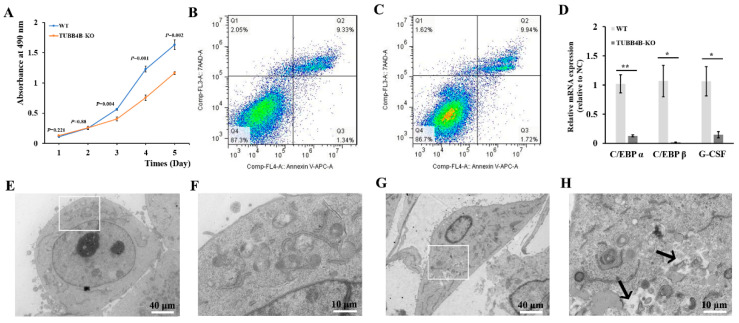
Figure 4.
Loss of Tubb4b affects the proliferation of mouse spermatogonia. (A): Cell growth curve of control and TUBB4B-KO mouse spermatogonia. The p-values were obtained by t-test comparing with the TUBB4B-KO and control spermatogonia; (B): Apoptosis detection of control mouse spermatogonia; (C): Detection of apoptosis in spermatogonia of TUBB4B-KO mouse spermatogonia; (D): Gene expression of control and TUBB4B-KO mouse spermatogonia on cell proliferation. ‘*’ means 0.01 ≤ p-value < 0.05, while ‘**’ means 0.001 ≤ p-value < 0.01; (E): WT cell ultrastructural. The magnification was 1200×, while the scale bar was 40 μm. And the white rectangles indicate the region of (F); (F): Enlarged view of (E). The magnification was 5000×, while the scale bar was 10 μm; (G): Tubb4b-KO cell ultrastructural. The magnification and scale bar were the same as in (E), and the white rectangles indicate the region of (H); (H): Enlarged view of (G). The magnification and scale bar were the same as in Figure 4F.

