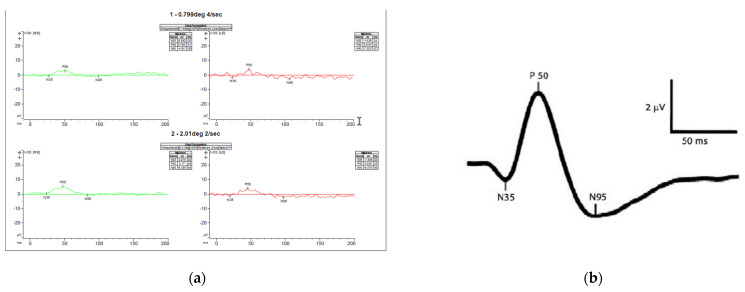
Figure 6.
Pattern ERG (a) recordings of Patient’s mother showing normal P50 amplitudes indicating normal photoreceptor function and decreased N95 amplitudes (not below the baseline) indicating ganglion cell dysfunction. (b) normal pattern ERG waveforms-the P50-wave is the initial positive deflection originating from RGCs and outer retinal photoreceptor cells, namely the macular cones. The N95-wave is the negative deflection following the P50-wave that originates from the inner retina. This wave component reflects the RGC function. The asterisks * means the values are relative to the baseline (flat line) and that is why some are positive (p) and other negative (n).

