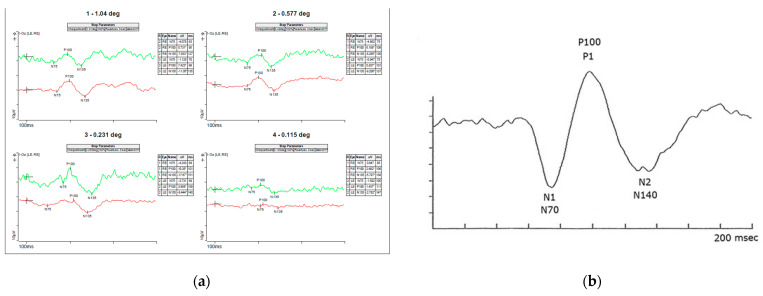
Figure 7.
Pattern VEP (a) recordings of Patient’s mother showing slightly decreased amplitudes more significant (b) normal pattern VEP waveforms showing the amplitude and latency to N70, P100 and N155 waves. The asterisks * means the values are relative to the baseline (flat line) and that is why some are positive (p) and other negative (n).

