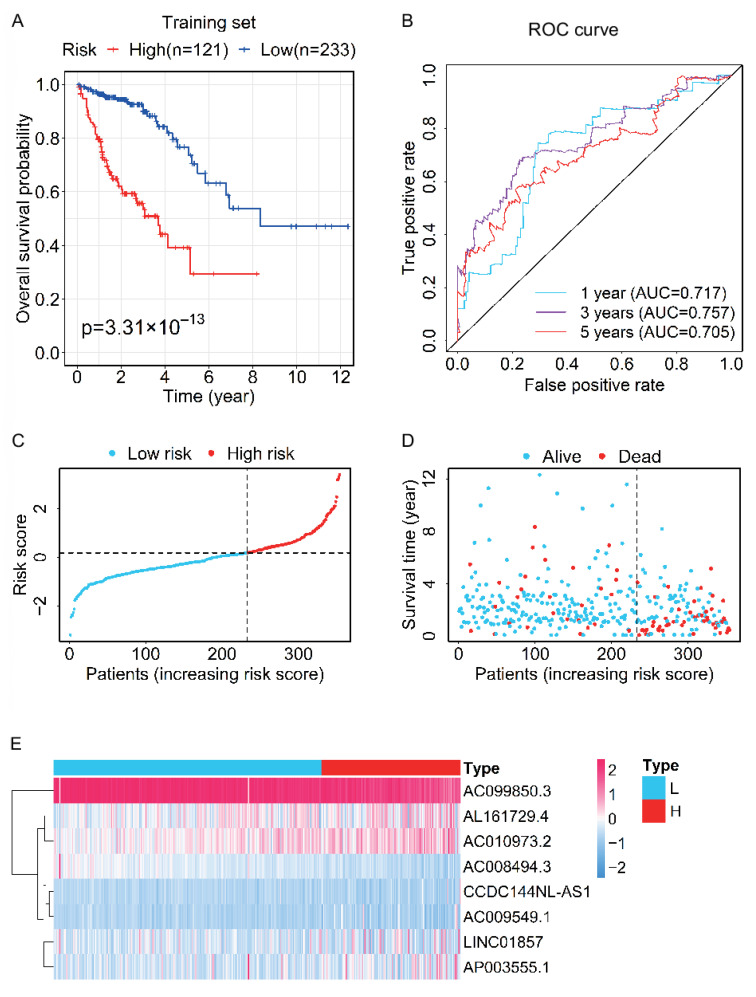
Figure 2.
Evaluation for the prognostic value of the lncRNA signature in the training set. (A) Kaplan–Meier survival curve for OS of CRC patients in the high- and low-risk groups. (B) The time-dependent ROC curves of OS based on the risk score indicate the prognostic accuracy of the 8-lncRNAs signature. (C) The distribution of risk scores of CRC patients. (D) The scatter plot shows the overall survival time and survival status of CRC patients in the high- and low-risk groups. (E) Heatmap of clustering analysis for the expression of eight ferroptosis-related lncRNAs. L, low risk; H, high risk.

