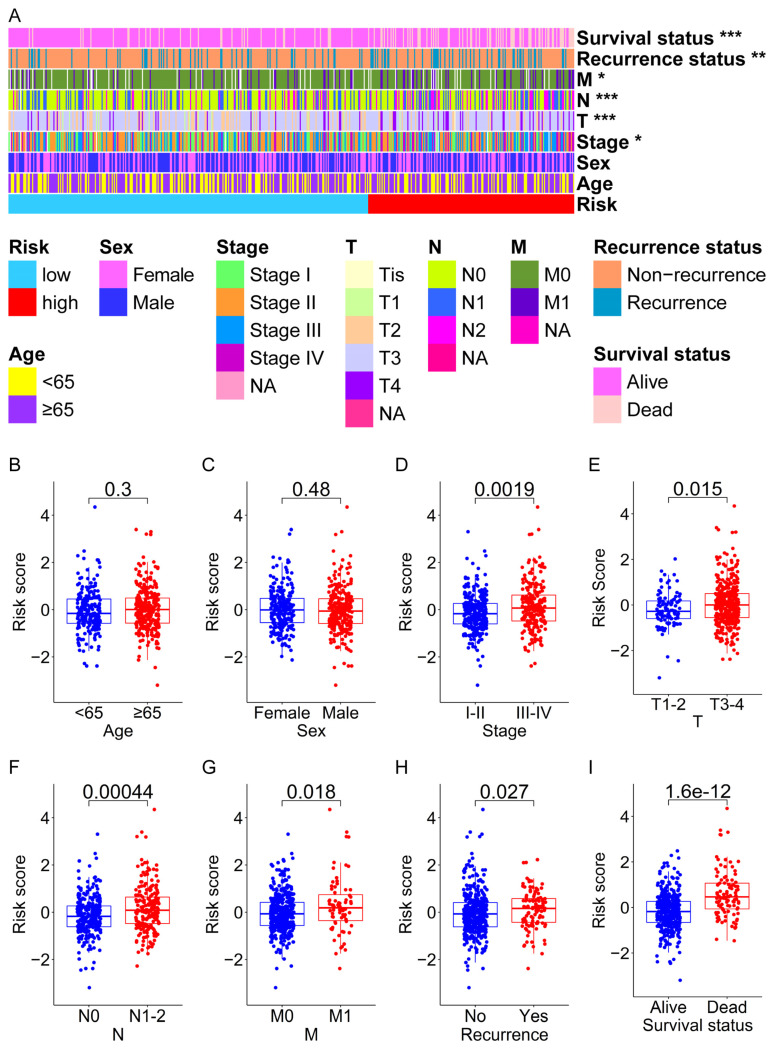
Figure 4.
The relationship between the risk score and clinical characteristics of CRC patients in the entire set. (A) The heatmap shows the distribution of clinical characteristics of patients between high-risk and low-risk groups. The box plots show that there is no significant difference in risk scores between patients with different ages (≥65 years old, <65 years old) (B) or patients with different sexes (female, male). (C,D) The box plot shows the risk scores of CRC patients with stage III–IV are significantly higher than that of stage I–II. (E) The box plot shows that the risk scores of CRC patients with the T3–4 stage are significantly higher than those of T1–2. (F) The box plot shows that the risk scores of CRC patients with the N1–2 stage are significantly higher than those of N0. (G) The box plot shows that the risk scores of CRC patients with the M1 stage are significantly higher than those of M0. (H) The box plot shows that the risk scores of CRC patients with tumor recurrence are significantly higher than those of tumor non-recurrence. (I) The box plot shows that the risk scores of dead patients are significantly higher than those of alive patients. * p < 0.05; ** p < 0.01; *** p < 0.001.

