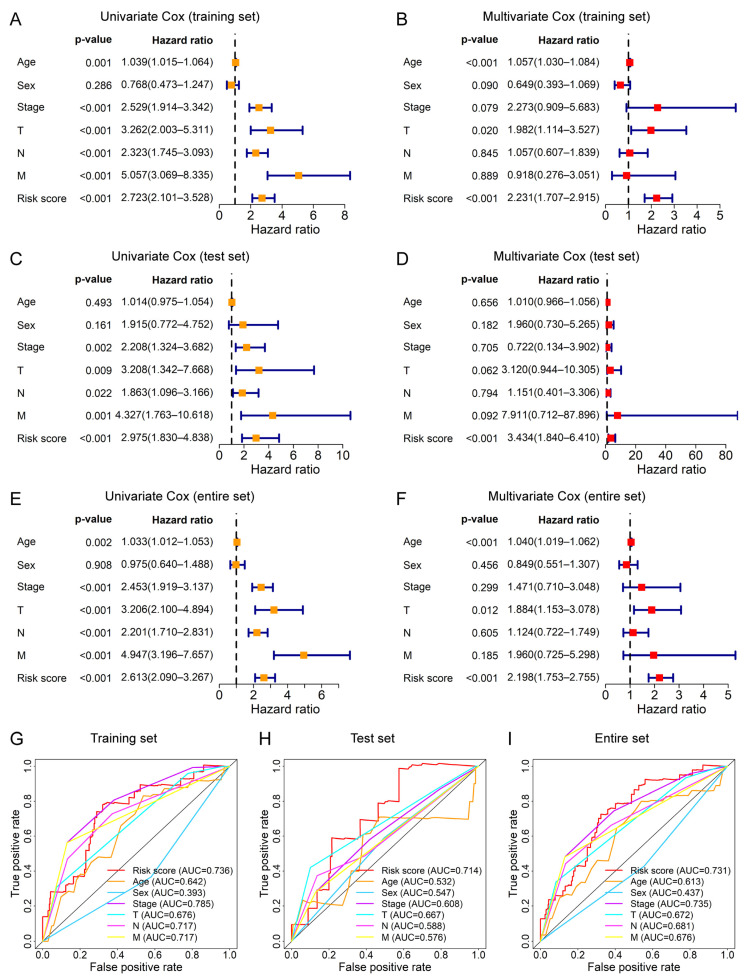
Figure 6.
Assessment for the prognostic independence of the risk score. (A,B) show the univariate Cox and multivariate Cox analysis of OS based on the risk score and clinical characteristics (age, sex, TNM stage, T stage, N stage, and M stage) in the training set, respectively. (C,D) show the univariate Cox and multivariate Cox analysis of OS based on the risk score and clinical characteristics in the test set, respectively. (E,F) show the univariate Cox and multivariate Cox analysis of OS based on the risk score and clinical characteristics in the entire set, respectively. The 1-year ROC curves of OS based on the risk score and clinical characteristics in the training set (G), test set (H), and entire set (I) indicate the prognostic accuracy of these variables. Unadjusted hazard ratios represent the 95% confidence intervals.

