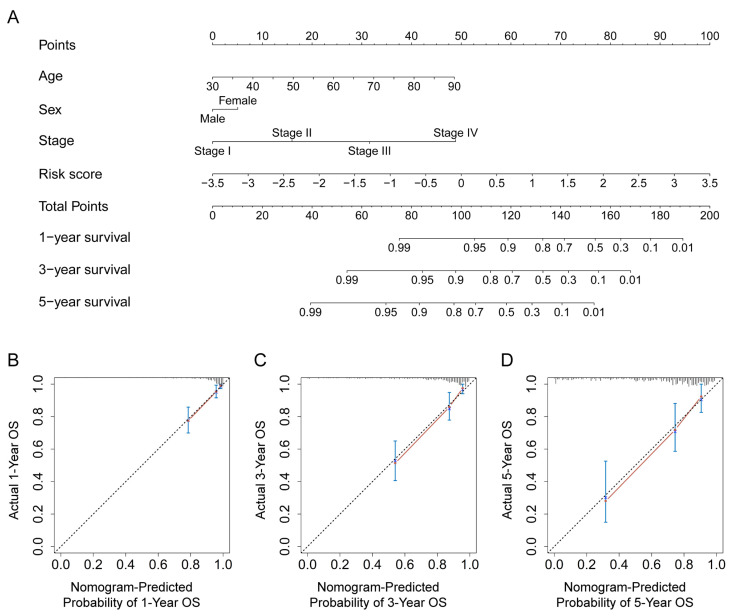
Figure 7.
Construction and verification of the nomogram in the training set. (A) The established nomogram, which contains several indicators, such as age, sex, TNM stage, and risk score, can predict the OS rate of 1, 3, and 5 years for CRC patients in the training set. The calibration curves at 1-year (B), 3-year (C), and 5-year (D) OS of the nomogram in the training set show the predicted result of the nomogram is close to the actual OS rate.

