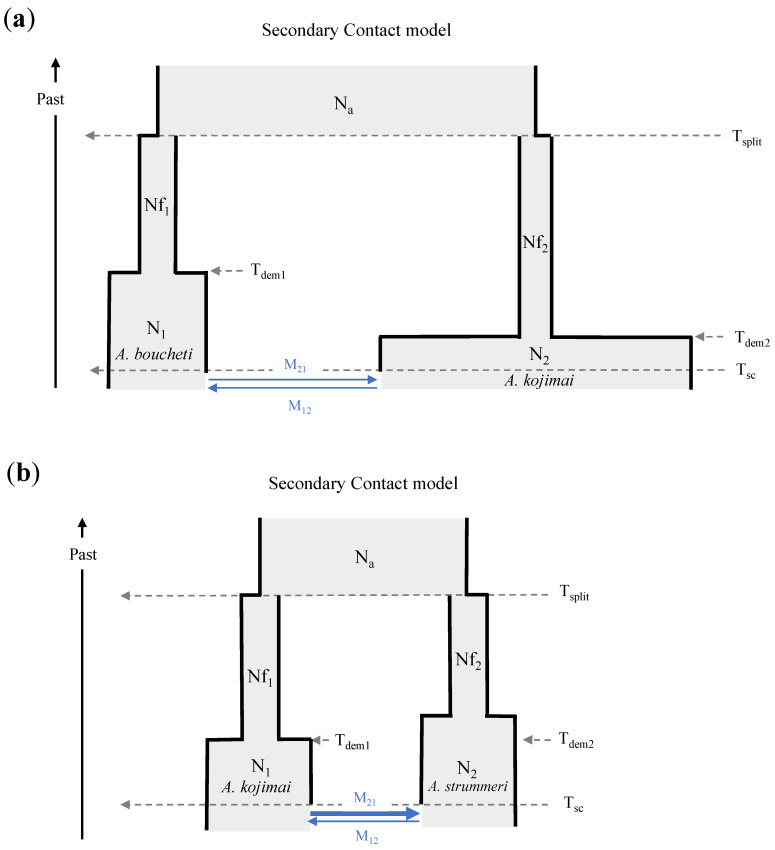
Figure 9.
Demographic models that best explained the data observed in this study. N1 and N2: effective size of population 1 and 2; Na: effective size of the ancestral population; Nf1 and Nf2: effective size of population 1 and 2 after the split (differences in population size parameters are approximately reflected by the width of each box); Tsplit: time of split at which the ancestral population subdivides in two populations; Tdem: time of the expansion of the population; Tsc: time of secondary contact at which the two populations start exchanging genes; M12 and M21: introgression rates from population 2 to 1 and from population 1 to 2, respectively (blue arrows). (a) Analysis for A. boucheti/A. kojimai; (b) analysis for A. kojimai/A. strummeri.

