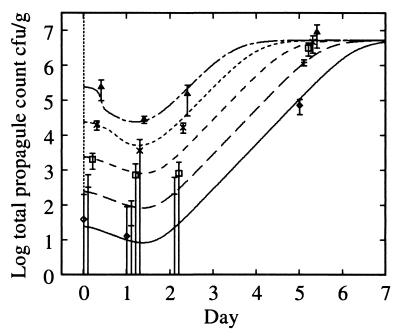
FIG. 5.
Fit of basic model to total propagule data of experiment 2, microcosms 2B to 2F. The data are time displaced for clarity. Error bars are 95%. The parameters are given in Table 3. Note the uniformity in the growth over the first 3 days, which reproduces the scaling behavior of Fig. 4. Symbols: 2B, ◊ (———); 2C, + (————); 2D, □ (–––––); 2E, × (-----); 2F, ▵, (—-—-—).

