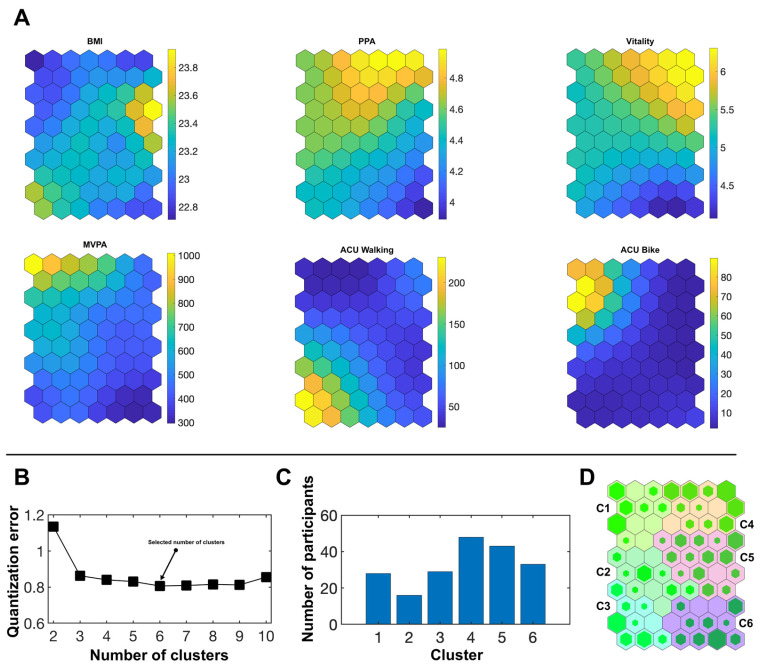
Figure 2.
Neuron networks, superordinate clusters and hits obtained by the SOM analysis in the male subsample. (A) Neuron networks for the SOM input variables. Yellow color represents the highest values of the sample distribution for each variable, dark blue color represents the lowest values. (B) Quantization error according to the possible number of clusters selected. (C) Number of participants per cluster for the chosen cluster solution. (D) Hits map with the six superordinate clusters C1–C6. The more a neuron is filled with green, the higher the number of participants assigned to the neuron. BMI = body mass index, PPA = perceived physical ability, MVPA = moderate-to-vigorous physical activity, ACU = active commuting to and from university.

