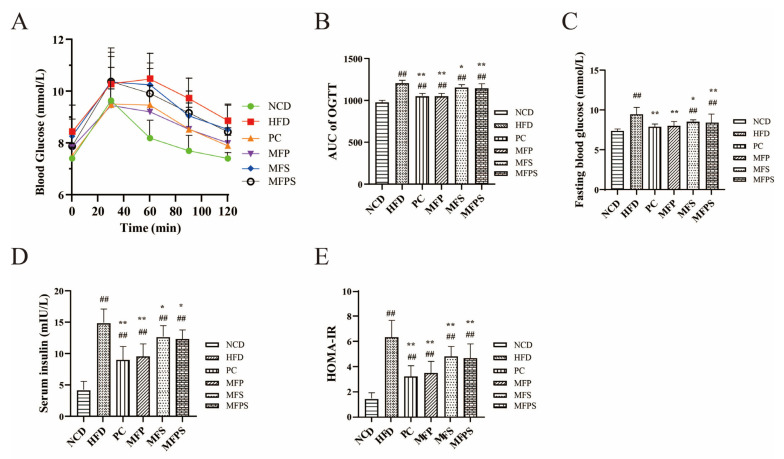
Figure 4.
The improvement of glucose tolerance and insulin resistance (IR) after MFP, MFS and MFPS treatments. (A) Oral glucose tolerance test (OGTT). (B) Area under the curve (AUC) of OGTT. (C) Fasting blood glucose. (D) Fasting serum insulin. (E) Homeostatic model assessment-insulin resistance (HOMA-IR) index. Data are expressed as the mean ± standard deviation (n = 12). ## p < 0.01 vs. NCD group; * p < 0.05, ** p < 0.01 vs. HFD group.

