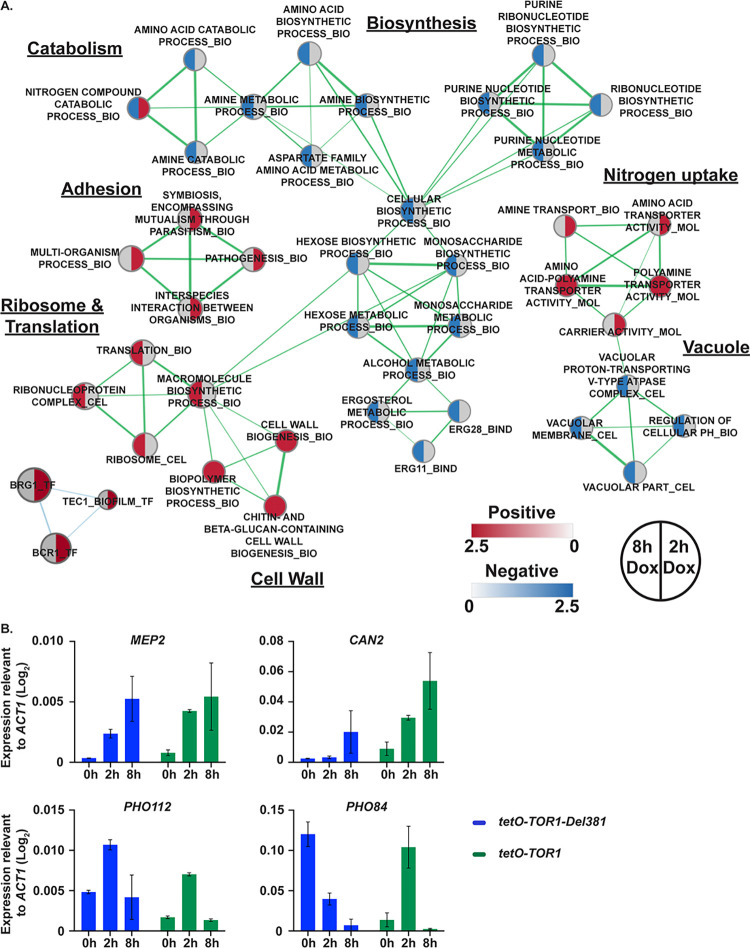
Fig 10. Classic TORC1-regulated gene sets were dysregulated during TOR1 repression in FL cells.
A. Enrichment map showing the major categories of genes identified by Gene Set Enrichment Analysis (GSEA) in the transcript profiles of tor1/tetO-TOR1 (JKC1549) cells repressed in 30 mg/ml doxycycline for 2 h or 8 h in YPD compared to tor1/TOR1 (JKC1347). Nodes represent gene sets (FDR q <0.1) where color intensity reflects the Normalized Enrichment Score (NES) and node size reflects the number of enriched genes. Grey color indicates category was not significantly enriched under this experimental condition. Width of connecting lines (edges) indicates the degree of overlap between categories. B. MEP2, CAN2, PHO112 and PHO84 gene expression quantification relative to ACT1 expression, after repressive (30 mg/ml) 2h and 8h doxycycline treatment in tor1/tetO-TOR1-Del381 (tetO-TOR1-Del381, JKC1441) and tor1/tetO-TOR1 (tetO-TOR1, JKC1549) strains.

