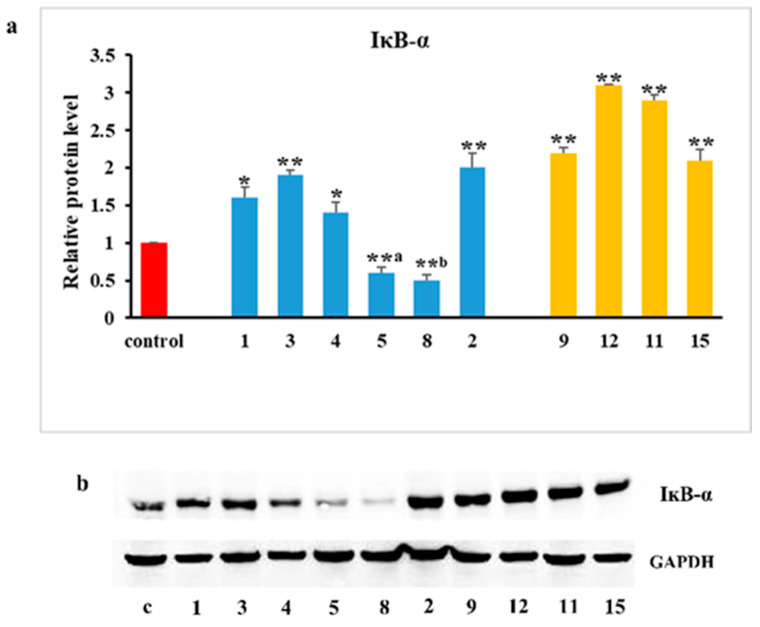
Figure 6.
Western blotting analysis of the levels of IĸB-α in HL60R cells. The cells were treated for 24 h with different compounds. (a): Relative protein level (mean ± standard error of three experiments). Differences when treatments are compared to the control: ** p < 0.01, * p < 0.05; derivates versus precursor: a p < 0.05; b p < 0.01 (one-way ANOVA followed by Tukey’s test). (b): Representative immunoblots of three independent experiments with similar results.

