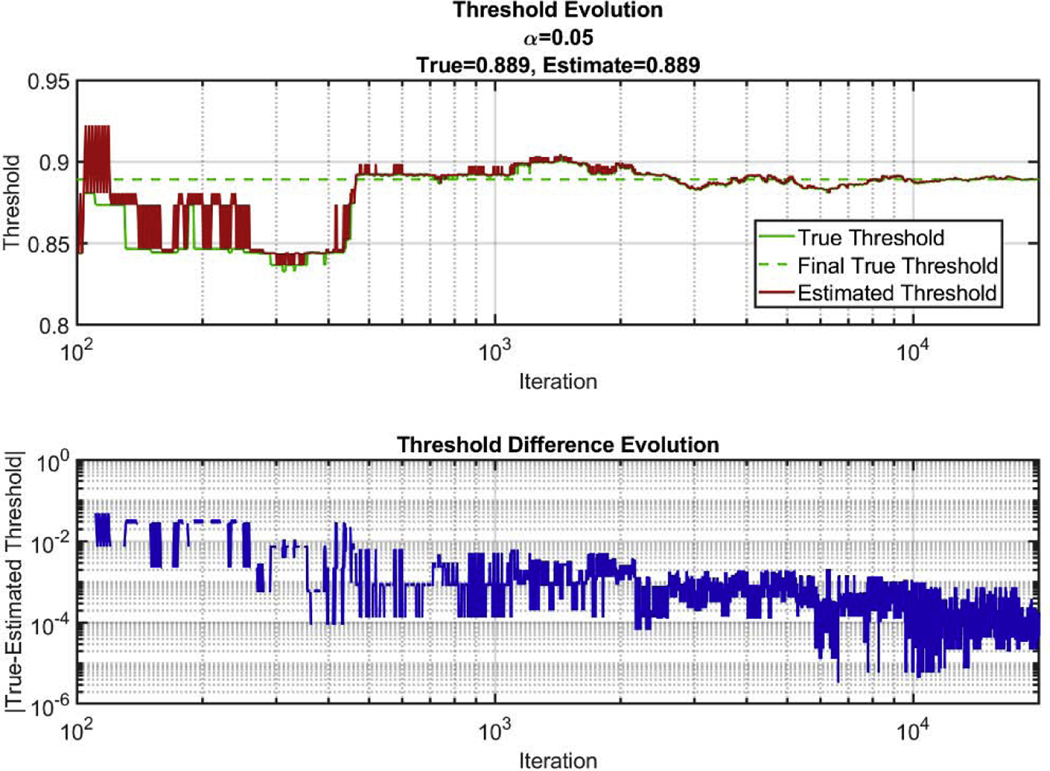
Figure 3:
Comparison of true 95th percentile and estimated 95th percentile of a test distribution. Top) True threshold over all iterations compared to estimated threshold. Bottom) Absolute value of the difference between the estimated threshold and the true threshold over all iterations. Note that the iteration axis starts at 100, since 100 samples were taken during initialization of the algorithm.

