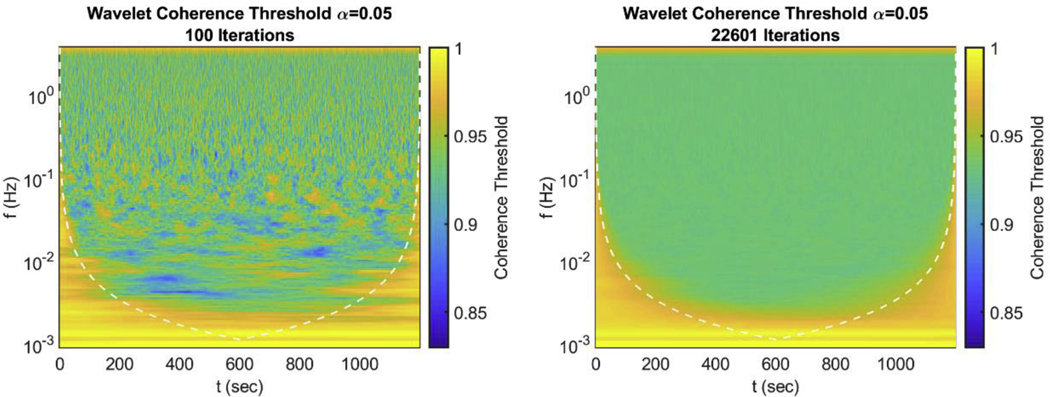
Figure 4:
Example map of coherence thresholds generated by the algorithm with size 9375 × 145 (1,359,375 pixels). Map confidence threshold for a 20 min long signal sampled at 7.8125 Hz with a frequency range from 0.001 to 3.730 Hz. Coherence was found using the MATLAB wcoherence function, modified to remove smoothing in frequency. Left) Thresholds generated form 100 iterations using the entire coherence distribution (initialization of the algorithm). Right) Thresholds generated using the algorithm in 24hr with 22601 iterations on a typical desktop computer.

