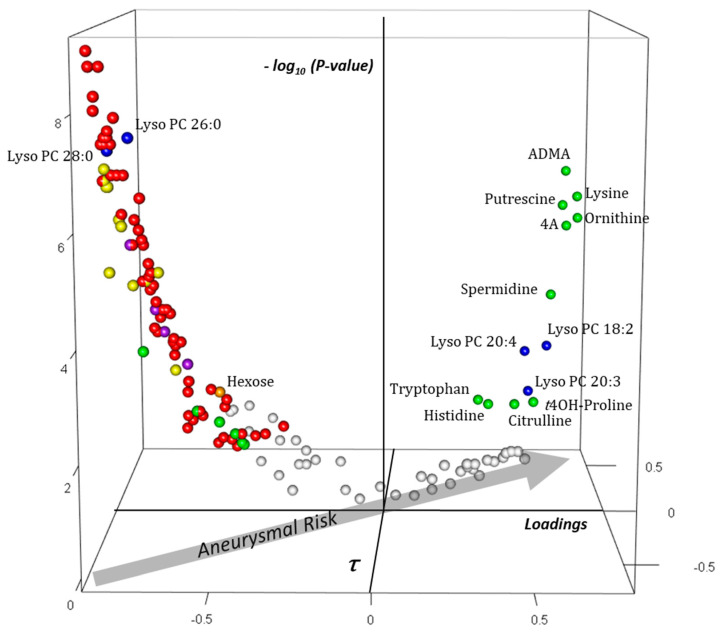
Figure 7.
Three-dimensional volcano plot for the aortic blocks according to t1,j. Coordinates for each metabolite represent loading (x-axis), Kendall τ coefficient (y-axis), and negative log-transformed p-values testing the null hypothesis τ = 0 (z-axis). Only significant metabolites (i.e., p at most equal to the α-threshold calculated according to the Benjamini–Hochberg procedure) have been colored. The arrow in the x,y-plane indicates that aneurysmal risk positively correlates with positive loadings and τ, as shown in the scatter plot of Figure 4. Each sphere represents one metabolite with the following color code: red: phosphatidylcholine species; yellow: sphingomyelin species; blue: lyso phosphatidylcholine species; violet: free and acylcarnitine species; green: amino acids and amino-acid-related metabolites; orange: hexoses. Carnitine is indicated by “C0”; acylcarnitines and lysophosphatidylcholine species are indicated by “C X:Y” and “Lyso PC X:Y” with X indicating the length of the acyl moiety and Y the number of double bonds in the acyl moiety, respectively. Abbreviations: ADMA: asymmetric dimethylarginine; 4A: α-aminoadipic acid; t4OH-Proline: trans4-hydroxyproline.

