Figure 5.
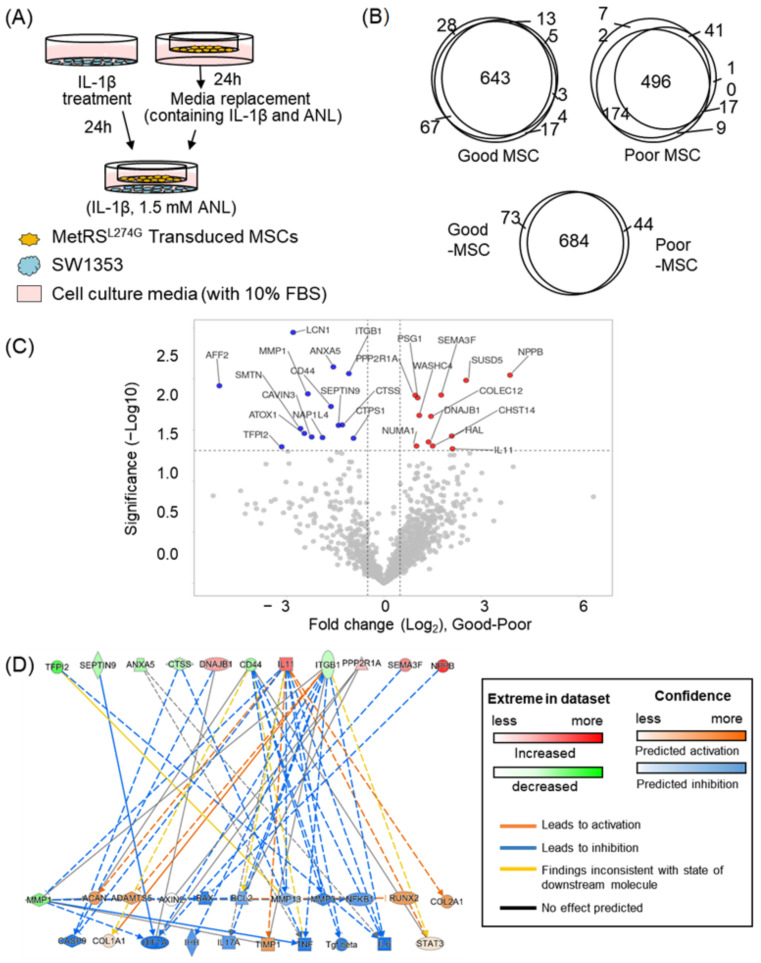
Analysis of secretome from MSCs co-cultured with osteoarthritis (OA)-induced cells. (A) Schematic workflow for analyzing secretome of MSCs that were co-cultured with OA-induced SW1353 cells. IL-1β was treated to induce OA. (B) The number of proteins identified in secretome of three good MSCs and three poor MSCs, as well as their inter- or intra-overlap; 90.4% of the identified proteins in the secretome of good MSCs were also identified in the secretome of poor MSCs. (C) Volcano plot displaying −log10 (p-value) vs. log2 (fold change, good MSCs over poor MSCs) for the identified proteins in the secretome of MSCs. Daggers indicate differentially expressed proteins between the two MSCs groups. Red and blue dots indicate proteins with increased expressions and decreased expressions in good MSCs, respectively. (D) Prediction of expression levels of OA-related genes based on the secretome profile using the Ingenuity pathway analysis (IPA) tool. The genes identified in our secretome profile are colored either green or red, while the genes whose expression levels are predicted by IPA are colored either blue or orange.

