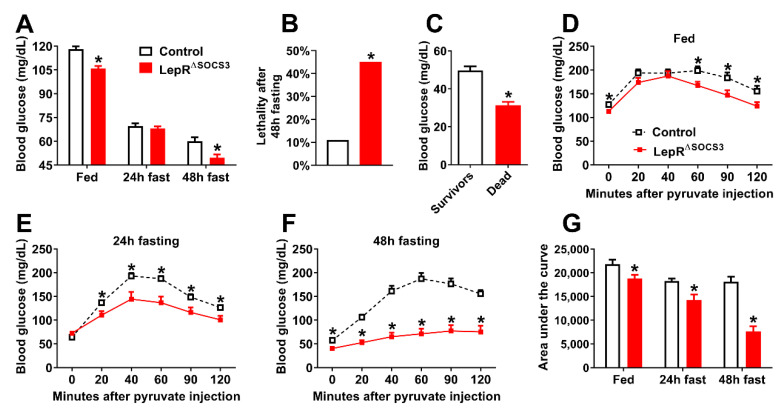
Figure 9.
LepR∆SOCS3 mice exhibit fasting-induced hypoglycemia that is associated with reduced gluconeogenesis. (A) Blood glucose concentrations at the fed state or after 24 h or 48 h fasting in young adult control (n = 40) and LepR∆SOCS3 (n = 32) mice. (B) Percentage of mice that died after a 48 h fasting period in control and LepR∆SOCS3 mice. (C) Blood glucose concentrations in mice that died (n = 20) or survived (n = 27) the 48 h fasting period (including the refeeding period). (D–F) Blood glucose concentrations during pyruvate tolerance tests in young adult control (n = 20–21) and LepR∆SOCS3 (n = 8–11) mice at the fed state or during 24 h or 48 h fasting. (G) Area under the curve of the pyruvate tolerance tests in control and LepR∆SOCS3 mice at the fed state or during 24 h or 48 h fasting. Mean ± SEM. * p < 0.05 control vs. LepR∆SOCS3 (post-hoc test two-way ANOVA or t-test).

