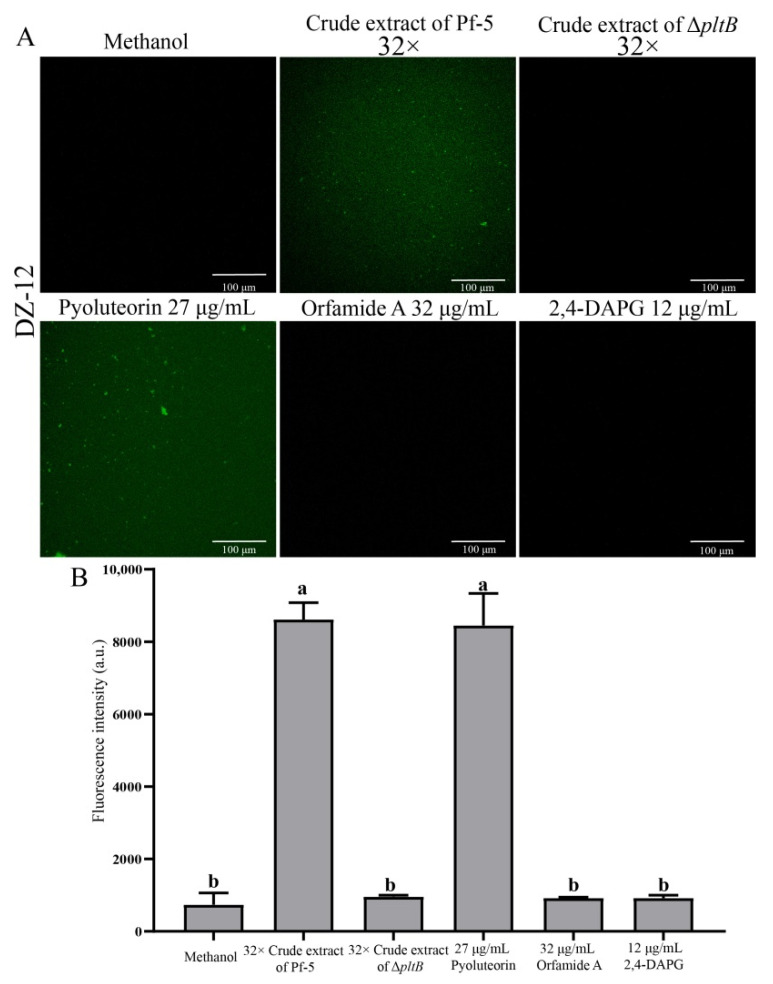
Figure 5.
The effects of crude extract on ROS production P. ananatis DZ-12 observed using a Leica SP5 confocal microscope (A), and analyzed by EnSight Multimode Plate Reader (B). A concentration of 32× dilutions of the crude extract from P. protegens Pf-5 and its mutant ΔpltB were used. A concentration of 27 μg/mL pyoluteorin, 32 μg/mL orfamide A, and 12 μg/mL 2,4-DAPG were also used. The graph data show the average fluorescence intensity value ± standard deviation of three replicates. Different letters represent statistically significant differences according to the one-way ANOVA test (p < 0.05).

