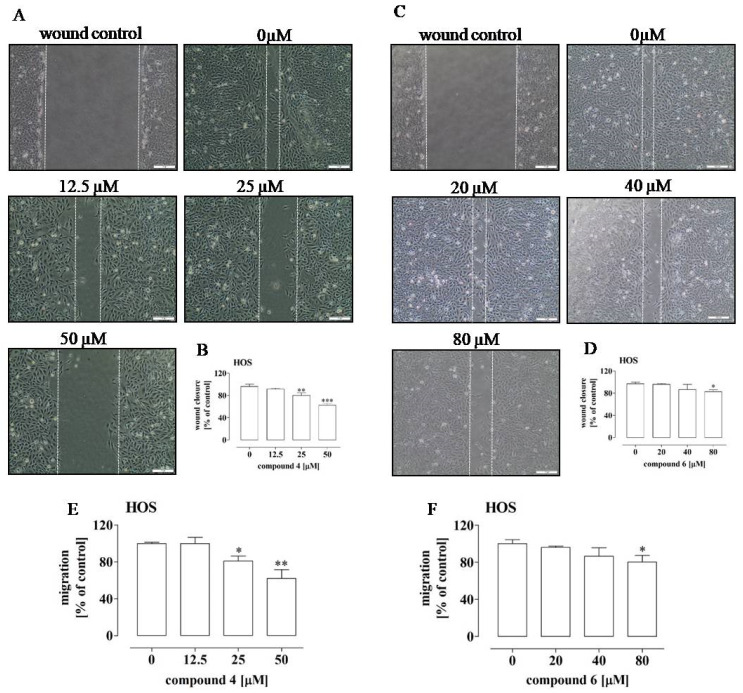
Figure 5.
Effect of compounds 4 and 6 on the migration of HOS cells. The cells were treated with the compounds at the indicated concentrations for 24 h. The photos (A,C) are representative and correspond with the migration activity of the cells expressed as a percentage of the control untreated cells (0 µM) (B,D). The cell migration was determined by means of the wound assay (A–D) and the transwell assay (E,F). The results are mean values ± SD of at least three independent experiments. Statistically significant differences: *—at p < 0.05; **—at p < 0.01 or ***—at p < 0.001 in comparison with the untreated cells (one-way ANOVA followed by Dunnett’s post-hoc test).

