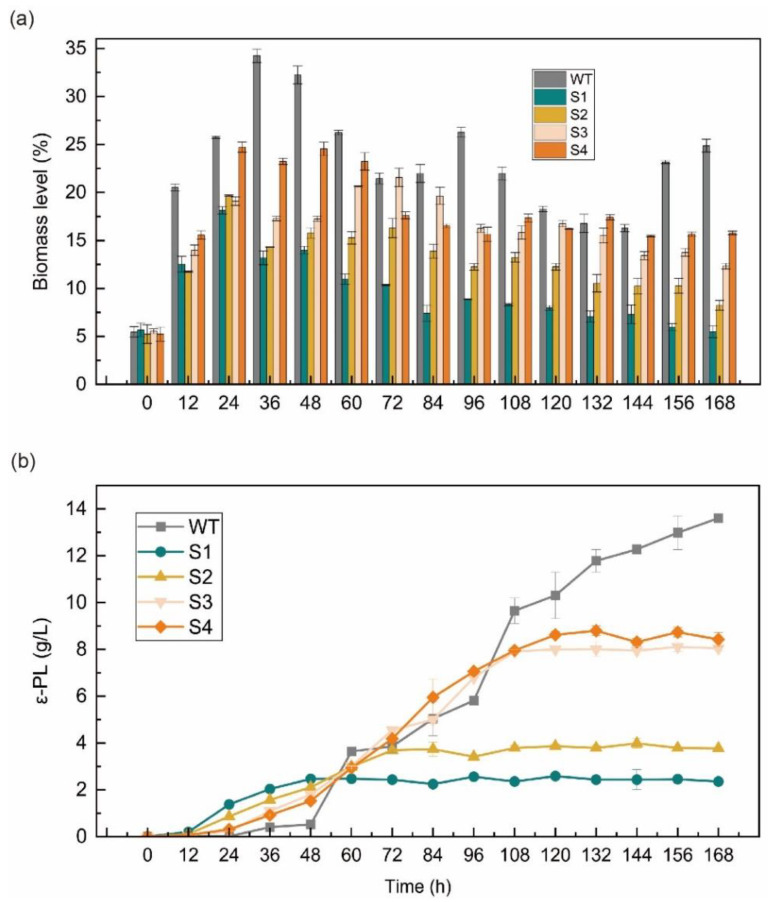
Figure 2.
Biomass level and ε-PL production of the S. albulus strain under 168 h fed-batch fermentations. (a) Biomass level of the WT and four repressed strains; (b) ε-PL production of the WT and four repressed strains. The data represent the means of three samples per time interval, and the error bars represent the standard deviation. Some error bars cannot be seen due to small standard deviations.

