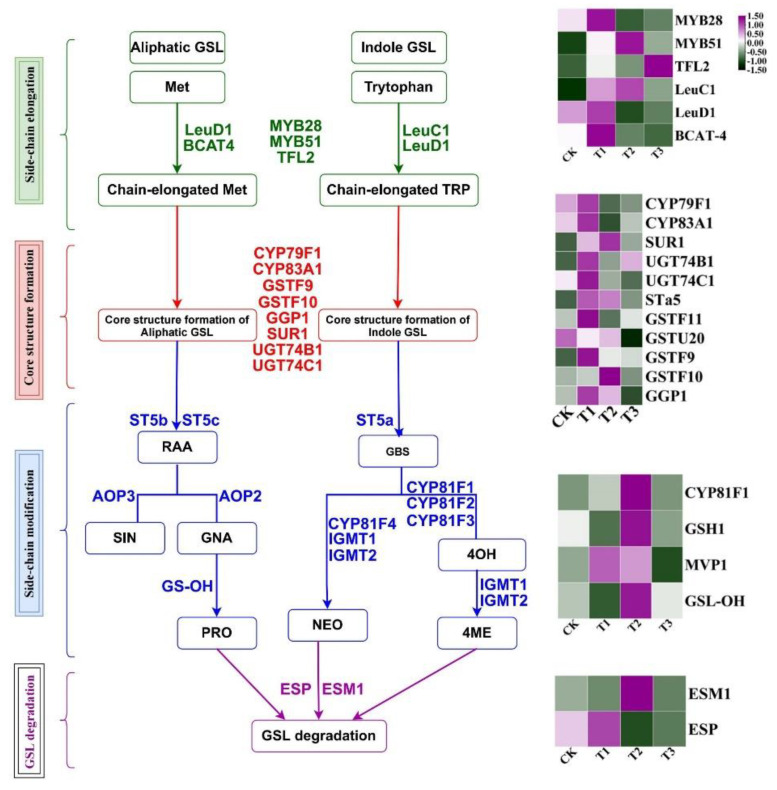
Figure 6.
The genes’ expression related to glucosinolate biosynthesis and metabolism in kale under supplemental UV-A light treatments. Results are visualized using a false color scale with purple as an increase parameter, while green indicates a decreased parameter. The full name of GSL variants has been described in Figure 5.

