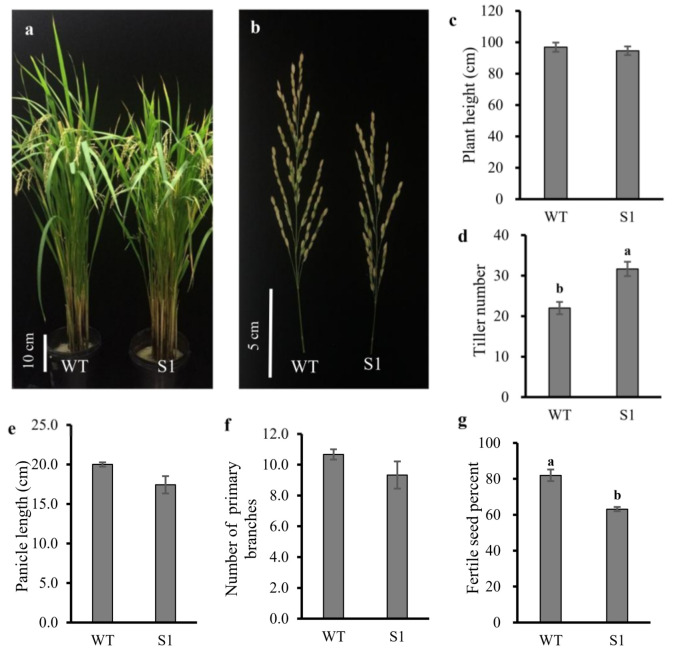
Figure 3.
Phenotypes of WT and the S1 mutant. (a) Phenotype comparison of the WT and the S1 mutant(b) The panicle of WT and the S1 mutant. The statistic calculation of agronomic traits of (c) plant height, (d) tiller number, (e) panicle length, (f) number of primary branches, and (g) fertile seed percentage. Lettering indicates statistical significance at p ≤ 0.01. Data are means ± standard deviation (SD) (n = 3).

