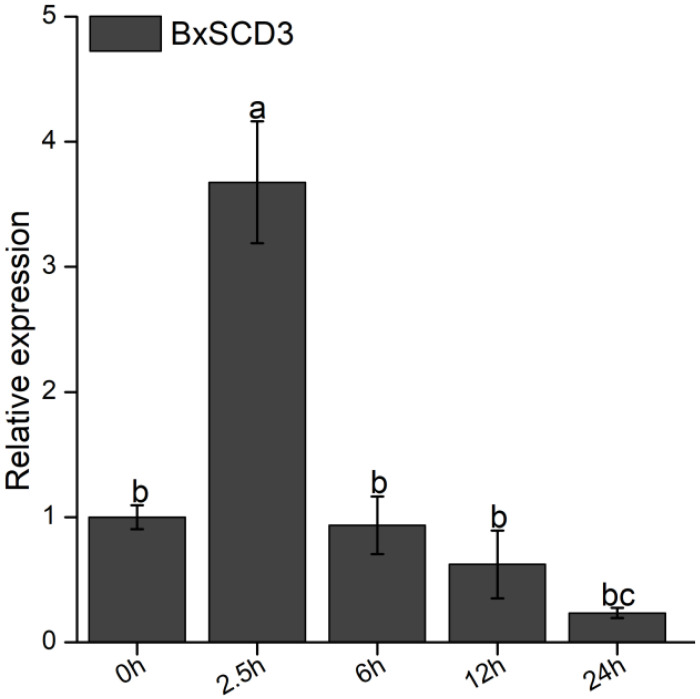
Figure 4.
Relative transcript level of BxSCD3 in Bursaphelenchus xylophilus during the early stages of infection. Data are the means, and the error bars represent ± standard deviation from three biological replicates. Different letters on top of the bars indicate statistically significant differences (p < 0.05, t-test) as measured by Duncan’s multiple range test.

