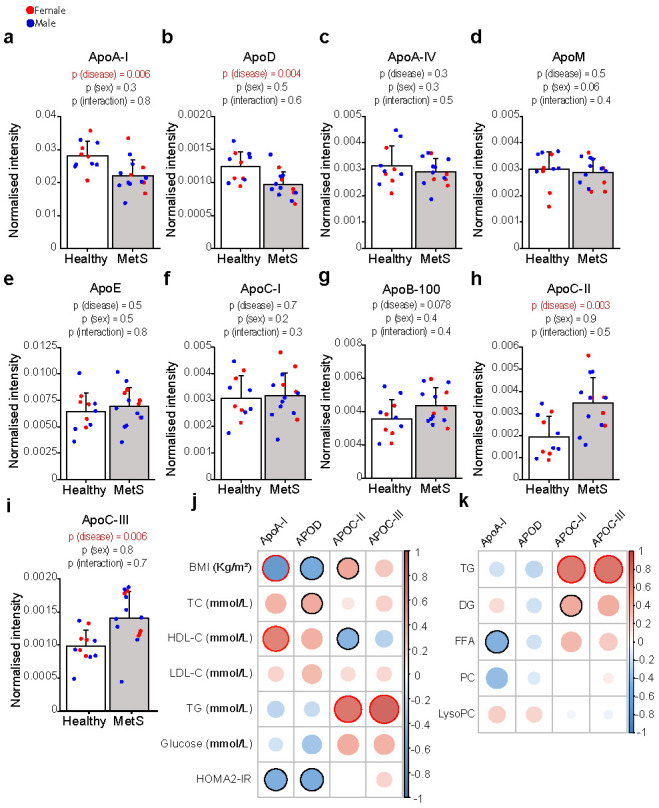
Figure 2.

Serum levels of major apolipoproteins in healthy and MetS participants. In MetS (n = 14), ApoA-I (a) and ApoD (b) were lower, ApoA-IV, ApoM, ApoE, ApoC-I and ApoB-100 (c–g) were not significantly different, whereas ApoC-II (h) and ApoC-III (i) were higher as compared with controls (n = 11). All apolipoproteins were analysed by liquid chromatography–mass spectrometry, as reported in the method section. Statistical significance was assessed using two-way ANOVA using the disease state and sex as covariates; a p-value < 0.05 was considered significant. Data are mean ± standard deviation. (j) Heatmap representing a correlation matrix among significantly different apolipoproteins and metabolic features in MetS and healthy controls: colour represents the Pearson correlation coefficient (red: positive; blue: negative), and the size of the circle represents significance (red bold borders highlight correlations with p < 0.01; black bold borders highlight correlations with p < 0.05). (k) Heatmap representing a correlation matrix among significantly different lipidomic and apolipoprotein species in MetS and healthy controls: colour represents the Pearson correlation coefficient (red: positive; blue: negative), and the size of the circle represents significance (red bold borders highlight correlations with p < 0.01; black bold borders highlight correlations with p < 0.05). Abbreviations: ApoA-I, apolipoprotein A-I; ApoD, apolipoprotein D; ApoA-IV, apolipoprotein A-IV; ApoM, apolipoprotein M; ApoE, apolipoprotein E; ApoC-I, apolipoprotein C-I; ApoB-100, apolipoprotein B-100; ApoC-II, apolipoprotein C-II; ApoC-III, apolipoprotein C-III; BMI, body mass index; TC total cholesterol; HDL-C, high-density lipoprotein cholesterol; LDL-C, low-density lipoprotein cholesterol; HOMA2-IR, Homeostasis Model Assessment 2 of Insulin Resistance.
