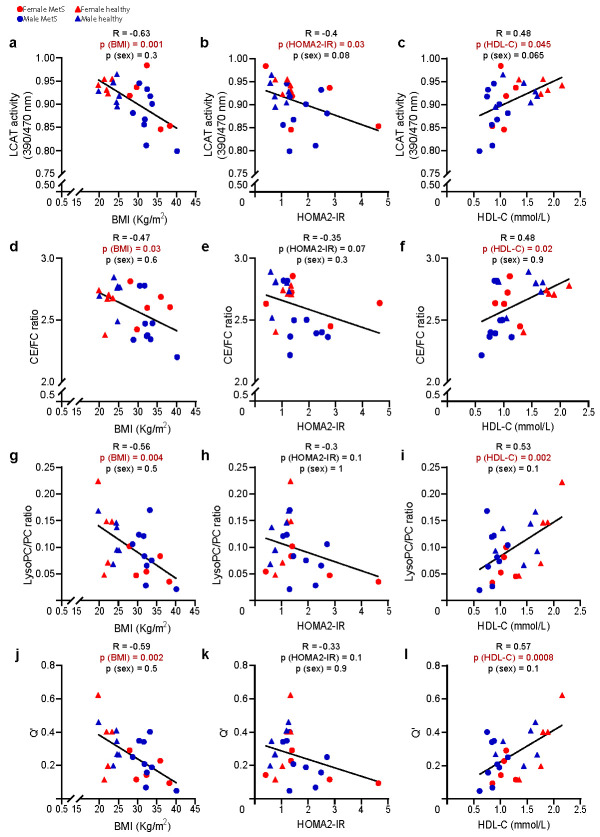
Figure 4.
Correlation between direct/indirect measurements of LCAT activity and metabolic risk factors. Lipidomic predictors and direct measurement of LCAT activity (a–l) were negatively correlated with BMI and HOMA2-IR and positively correlated with HDL-C. All measurements were performed on MetS (n = 14) and controls (n = 11). Lipid species were analysed by liquid chromatography–mass spectrometry except for FC and CE, which were analysed colorimetrically, as reported in the method section. The correlation between variables was assessed with Pearson’s correlation coefficient; the statistical significance was calculated using multiple regression to control for the effect of sex; a p-value < 0.05 was considered significant. Abbreviations: LCAT, lecithin–cholesterol acyltransferase; CE, cholesteryl esters; FC, free cholesterol; LysoPC, lysophosphatidylcholines; PC, phosphatidylcholines; Q’, (CE*LysoPC)/(FC*PC); BMI, body mass index; HDL-C, high-density lipoprotein cholesterol; HOMA2-IR, Homeostasis Model Assessment 2 of Insulin Resistance.

