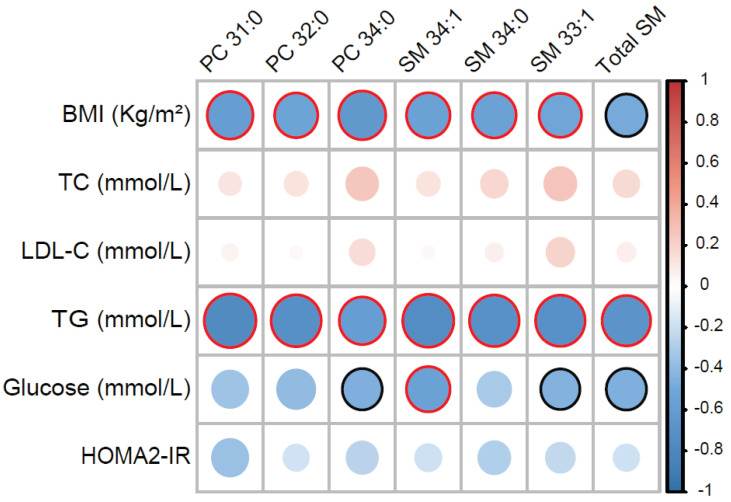
Figure 6.
HDL lipid species correlate with clinical features of metabolic impairment. Heatmap representing a correlation matrix among highly significantly different HDL lipid species (p < 0.01) and metabolic parameters in MetS (n = 14) and healthy controls (n = 11): colour represents the Pearson correlation coefficient (red: positive; blue: negative), and the size of the circle represents significance (red bold borders highlight correlations with p < 0.01; black bold borders highlight correlations with p < 0.05). Abbreviations: PC, phosphatidylcholines; SM, sphingomyelins; BMI, body mass index; TC total cholesterol; LDL-C, low-density lipoprotein cholesterol; TG, triglycerides; HOMA2-IR, Homeostasis Model Assessment 2 of Insulin Resistance.

