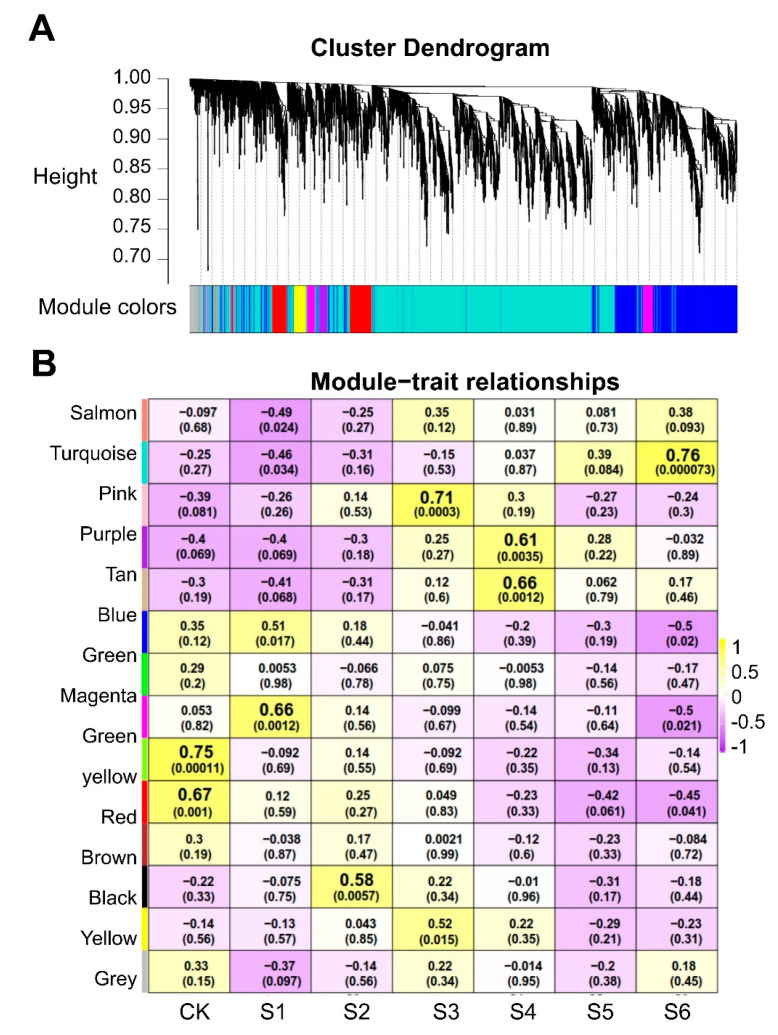
Figure 9.
Weighted correlation network analysis (WGCNA) coexpression network and module-trait correlation analysis under salt stress. (A) Hierarchical cluster tree showing the coexpression modules. Different colors indicate different modules. (B) Correlation analysis between different modules and salt stress duration. The top number in the cell represents the correlation coefficient and the bottom number indicates the p value.

