Figure 6.
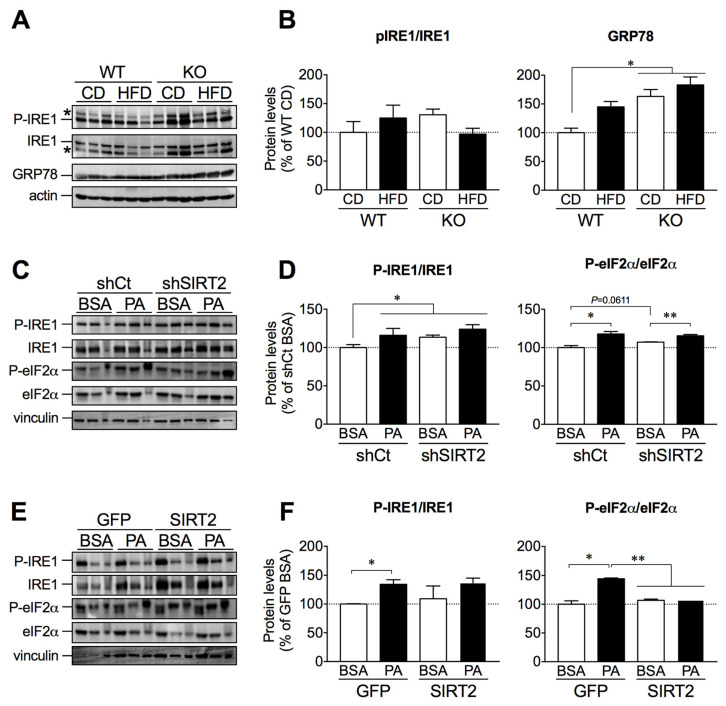
SIRT2 overexpression blunted palmitate-induced ER stress activation. (A) Representative Western blots of liver lysates showing P-IRE1 (Ser724), IRE1, and GRP78 levels from WT and SIRT2-KO mice fed a CD or HFD. (B) In the same lane, levels of P-IRE1 (Ser724) were normalized to IRE1, while GRP78 levels were normalized to actin. Values in the graph were normalized for the control condition (WT CD). n = 5–6 per group. (C) Representative Western blots of P-IRE1 (Ser724), IRE1, P-eIF2α (Ser51), and eIF2α of control HepG2 cells or SIRT2-silenced cells treated with BSA (vehicle) or palmitate (0.5 mM) for 24 h. (D) In the same lane, levels of P-IRE1 (Ser724) and P-eIF2α (Ser51) were normalized to IRE1 and eIF2α, respectively. Values in the graph were normalized for the control (shCT BSA). n = 3 per group. (E) Representative Western blots of P-IRE1 (Ser724), IRE1, P-eIF2α (Ser51), and eIF2α of control HepG2 cells or SIRT2-overexpressing cells treated with BSA (vehicle) or palmitate (0.5 mM) for 24 h. (F) In the same lane, levels of P-IRE1 (Ser724) and P-eIF2α (Ser51) were normalized to IRE1 and eIF2α, respectively. Values in the graph were normalized for the control (BSA GFP). n = 3 per group; * p < 0.05, ** p < 0.01.

