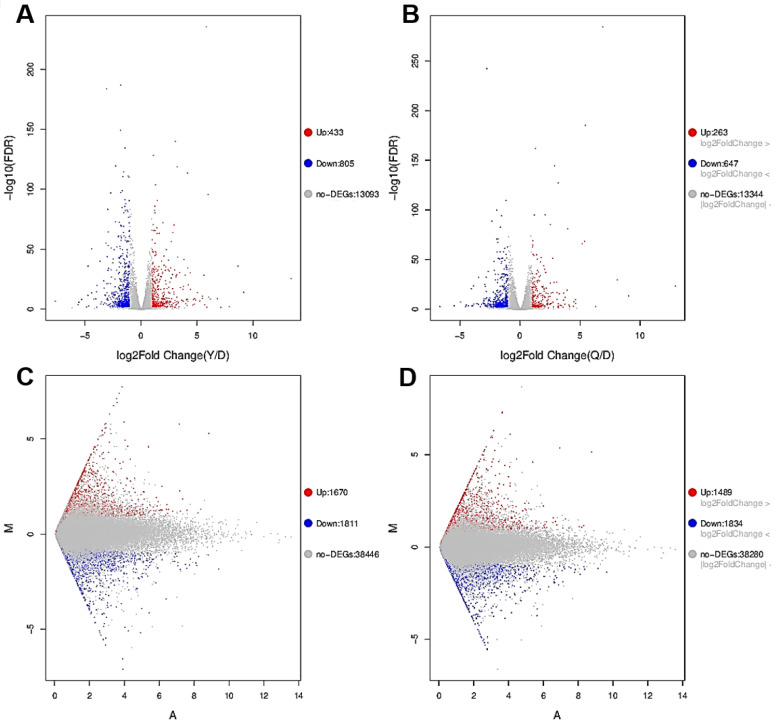
Figure 4.
RNA-seq analysis of DEGs and DETs of ZnO NPs and ZnO in a HepG2 cell. (A) Volcano map of DEGs between ZnO NPs (20 µg/mL) and control group. (B) Volcano map of DEGs between ZnO (20 µg/mL) and control group. (C) MA map of DETs between ZnO NPs (20 µg/mL) and control group. (D) MA map of DETs between ZnO (20 µg/mL) and control group. The red dots represent genes that were significantly upregulated, and the blue dots represent genes that were significantly downregulated (n = 3).

