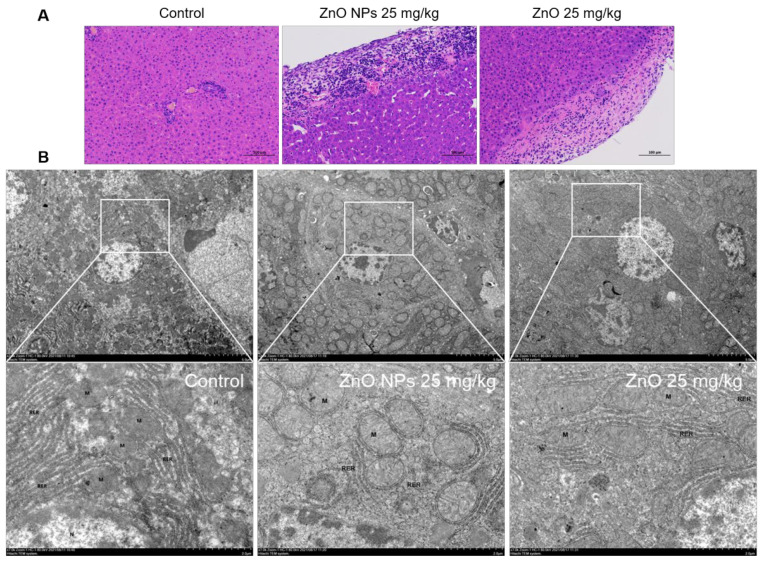
Figure 12.
Comparison of rat liver damage induced by ZnO NPs and ZnO. (A) Histopathology of HE-stained liver sections from ZnO NP and ZnO-treated rat tissue (Bar = 100 μm). (B) Effect of ZnO NPs and ZnO on ultrastructure changes in rat liver, as observed with an electron microscope (Bar = 5 or 2 μm).

