
Figure 2.
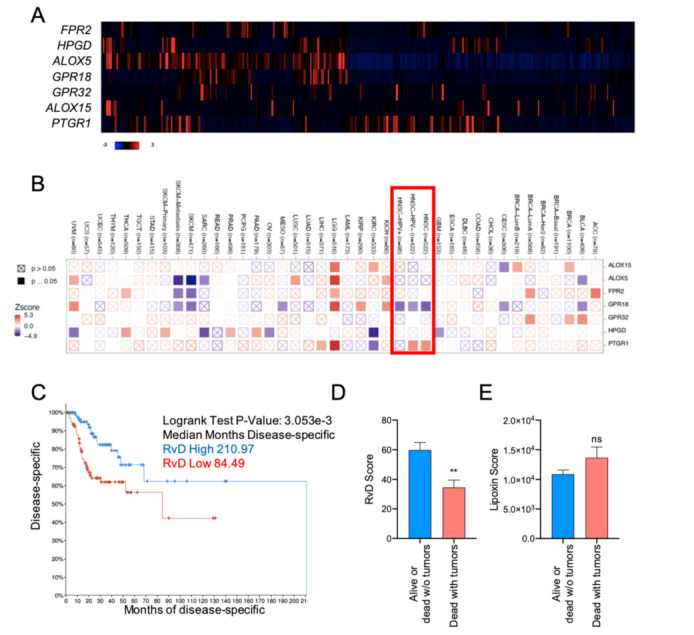
A higher RvD score is associated with more favorable outcomes in HNSC. (A) Heatmap of individual genes involved in SPM production in HNSC patients. mRNA expression z-scores relative to diploid samples (RNA Seq V2 RSEM) are shown. Patients are reported in columns, genes in rows. Blue: lower expression; red: higher expression. Color code is reported at the bottom of the panel. (B) Association between individual SPM genes and overall survival in multiple TCGA datasets. The heatmap (TIMER 2.0, Gene_Outcome mode) shows the normalized coefficient (z-score) of association between individual gene expression and overall survival (red: inverse association; blue: direct association) adjusted for age, gender, stage and purity. A red rectangle highlights HNSC cancers. Filled squares indicate significant (p < 0.05) associations predicted in multiple cancer types. TCGA study abbreviations were reported according to the NCI genomic data commons. (C) Kaplan–Meier curve survival analysis of HNSC patients stratified for high (n = 100) or low (n = 100) RvD score. Logrank test p-value and median months progression free are reported. (D) RvD score in HNSC from TCGA datasets in tumor-free alive or dead patients (n = 362) vs. patients’ death with symptoms of cancer (n = 128). Clinical data were extracted from the TCGA HNSC database using the cBioportal software. ** p < 0.01, Student t test. (E) Lipoxin score in HNSC from TCGA datasets in tumor-free alive or dead patients (n = 362) vs. patients dead with tumors (n = 128). Clinical data were extracted from the TCGA HNSC database using the cBioportal software. p = ns, Student t test.