
Figure 3.
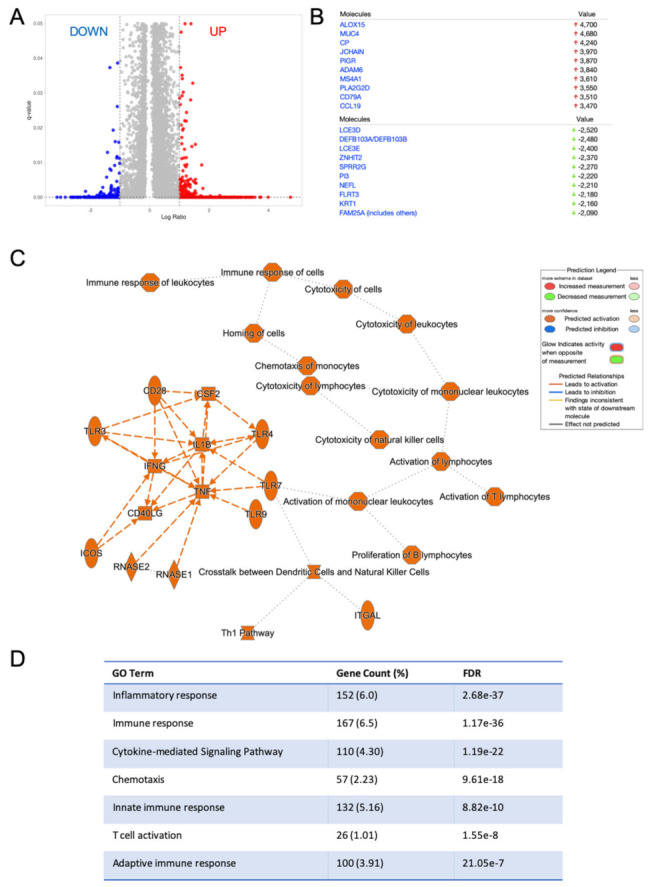
Differentially expressed genes in HNSC patients with a higher RvD score are associated with modulation of the immune-inflammatory reaction. (A) Volcano plot (prepared with VolcaNorseR) of gene expression patterns reporting up- down- (254 transcripts) or up- (2304 transcripts) regulated genes in patients with a high RvD score with a ±2 fold-change cut-off (corresponding to 1 in the log2 scale reported in the figure) and q-value < 0.05. (B) Top down (green arrows) and up-regulated genes in patients with a high RvD score. (C) Graphical summary of the major biological themes in high RvD tumors as determined by IPA core analysis of differentially expressed genes filtered as described above. The inset shows key legends. Solid lines represent direct interactions, while dashed lines represent indirect interactions. (D) Gene ontology (GO) of enriched biological themes in high vs. low RvD score patients identified by DAVID. Shown are GO Term, total and percentage of differentially expressed genes and False Discovery Rate (FDR).