
Figure 6.
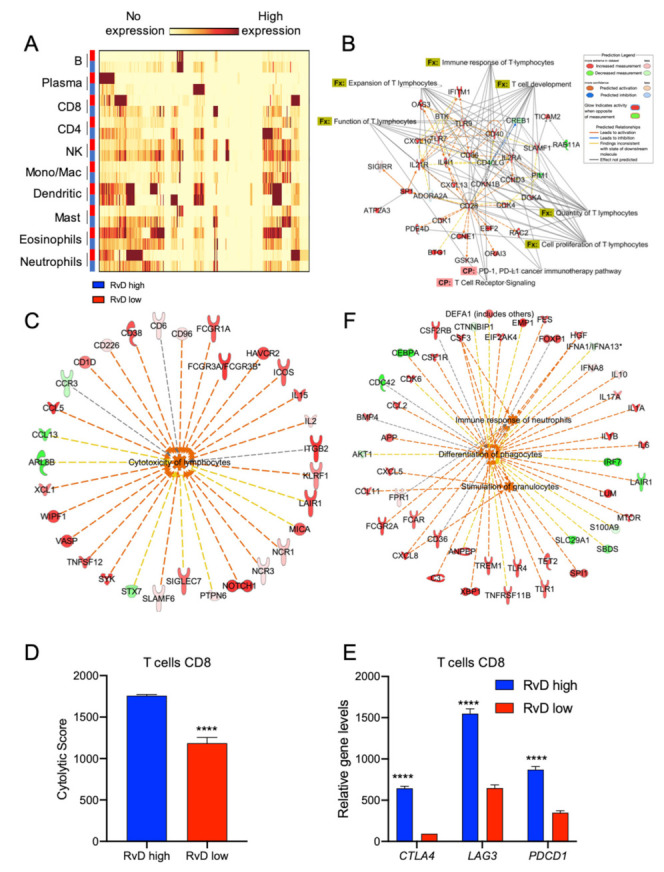
Higher RvD scores distinguish tumors with increased activation state in selected immune cells. (A) HNSC bulk RNA-seq were analyzed with the gene expression module of CIBERSORT to impute cell type specific expression profiles of 10 human immune subsets (LM10). The heatmap, generated with BioVinci, shows the gene expression profile of immune cells in tumors with high (blue rectangles) vs. low (red rectangles) RvD score. (B) IPA findings of biological functions (Fx) and canonical pathways (CP) associated with T lymphocytes activation and functions. (C) IPA findings of molecular network associated with increased lymphocyte cytotoxicity in RvD high score HNSC. (D) Cumulative CD8+ T cell cytolytic score in in high (n = 100) vs. low (n = 100) RvD score tumors. Data are shown as bars calculated on RSEM gene normalized values. ****, p < 0.0001, Student t test. (E) Mean gene expression levels (RSEM gene normalized values) of immunotherapy targets in CD8+ T cells stratified as high (n = 100) and low (n = 100) accordingly to their RvD score. ****, p < 0.0001, two-way ANOVA and Sidak’s multiple comparisons test. (F) IPA findings of biological functions associated with PMN activities.