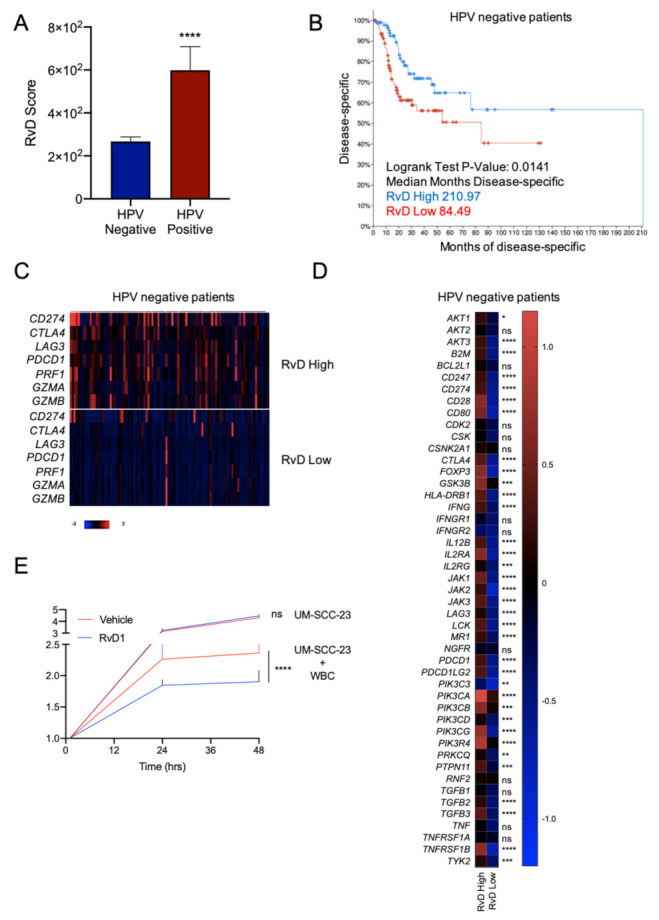
Figure 7.

Higher RvD scores are associated with improved outcomes in HPV negative HNSC. (A) RvD score in HPV negative (n = 415) vs. HPV positive (n = 72) HNSC. **** p < 0.0001, Student t test. (B) Kaplan–Meier curve survival analysis of HPV negative HNSC patients stratified as high (n = 100) or low (n = 100) RvD score. Logrank test p-value and median months progression free are reported. (C) Heatmap of gene expression levels of immunotherapy targets and cytotoxic effectors in high (n = 100) vs. low (n = 100) RvD score in HPV negative HNSC patients. mRNA expression z-scores relative to diploid samples (RNA Seq V2 RSEM) are shown. Patients are reported in columns, genes in row. Color code is reported at the bottom of the panel. Blue: lower expression; red: higher expression. (D) Heatmap of gene expression levels of genes involved in the PD-1, PD-L1 cancer immunotherapy pathway (IPA). Shown are the mean expression levels of mRNA z-scores relative to diploid samples in HPV negative tumors with RvD high (n = 100) and RvD low (n = 100) score. * p < 0.05; ** < 0.01; *** p < 0.001; ****, p < 0.0001, two-way ANOVA and Sidak’s multiple comparisons test. (E) Growth of the HPV negative HNSC cell line UM-SCC-23 during co-incubations with purified blood-derived human leukocytes from n = 5 healthy donors exposed to RvD1 (10 nM) or vehicle control. Cell growth was monitored up to 48 h with an impedance-based real time cell analysis (ACEA). Target UM-SCC-23 cells treated with vehicle or RvD1 in the absence of leukocytes were used as control. Data are expressed as relative cell growth normalized at the start of treatments. ****, p < 0.0001, one-way ANOVA.
