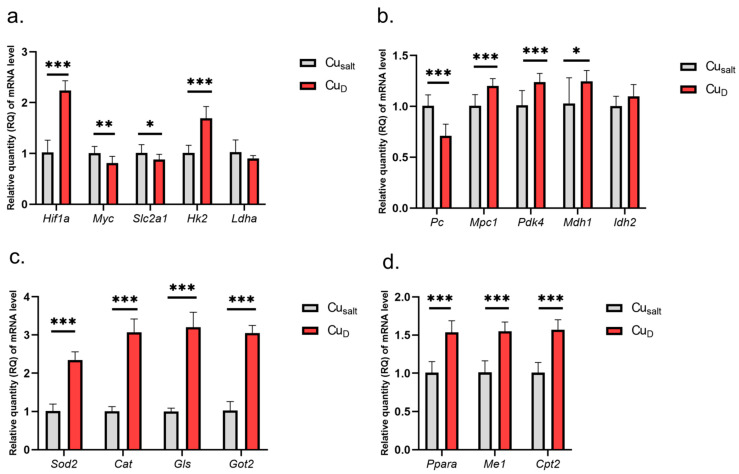
Figure 1.
(a–d) Results of mRNA expression in a group of rats with copper deprivation. All values are reported as mean ± standard deviation of relative quantity of mRNA level (n = 10). Significance: * p ≤ 0.05, ** p ≤ 0.01, *** p ≤ 0.001 vs. control group (Student’s t-test). Cusalt, control group, treated with mineral mix; CuD, group treated with mineral mix deprived copper.

