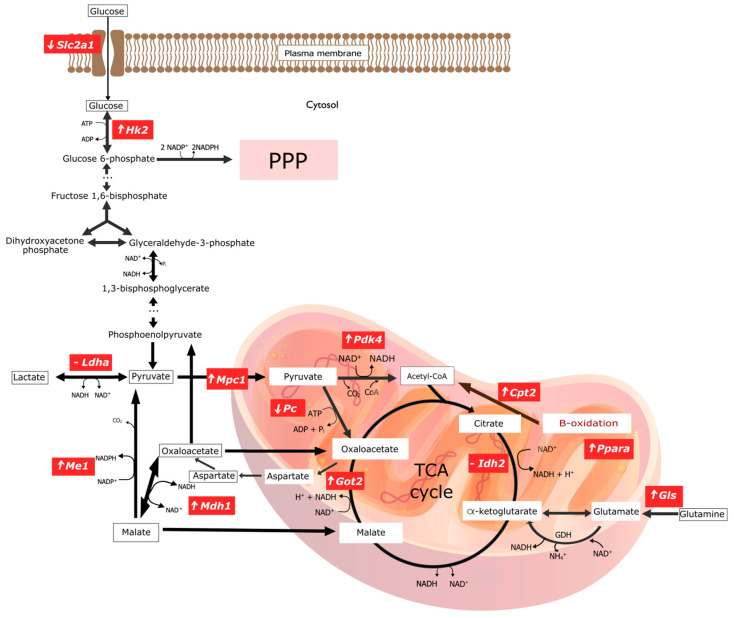
Figure 2.
Graphical representation of changes in gene expression encoding key enzymes involved in selected pathways of energy transformations in experimental group of rats with copper deficiency. ‘⬆’ indicates overexpression of the gene encoding the given enzyme; ‘⬇’ indicates a downexpression of the gene encoding the given enzyme; ‘-’ means there are no significant statistical changes. The graphic was made in the open-source vector graphics editor InkScape. ADP, Adenosine diphosphate; ATP, Adenosine triphosphate; CO2, Carbon dioxide; CoA, Coenzyme A; Cpt2, Carnitine Palmitoyltransferase 2; GDH, Glutamate dehydrogenase; Gls1, Kidney-type glutaminase, mitochondrial; Got2, Glutamic-Oxaloacetic Transaminase 2; Hk2, Hexokinase 2; Idh2, Isocitrate Dehydrogenase (NADP+) 1; Ldha, Lactate Dehydrogenase A; Mdh1, Malate Dehydrogenase 1; Me1, Malic Enzyme 1; Mpc1, Mitochondrial Pyruvate Carrier 1; NAD+, Nicotinamide adenine dinucleotide; NADH, Nicotinamide adenine dinucleotide, reduced form; NH4+, Amonium; Pc, Pyruvate Carboxylase; Pdk4, Pyruvate Dehydrogenase Kinase 4; Pi, Pyruvic acid; Ppara, Peroxisome Proliferator Activated Receptor Alpha; PPP, Pentose Phosphate Pathway; Slc2a1, Solute Carrier Family 2 Member 1; TCA cycle, The tricarboxylic acid cycle.

