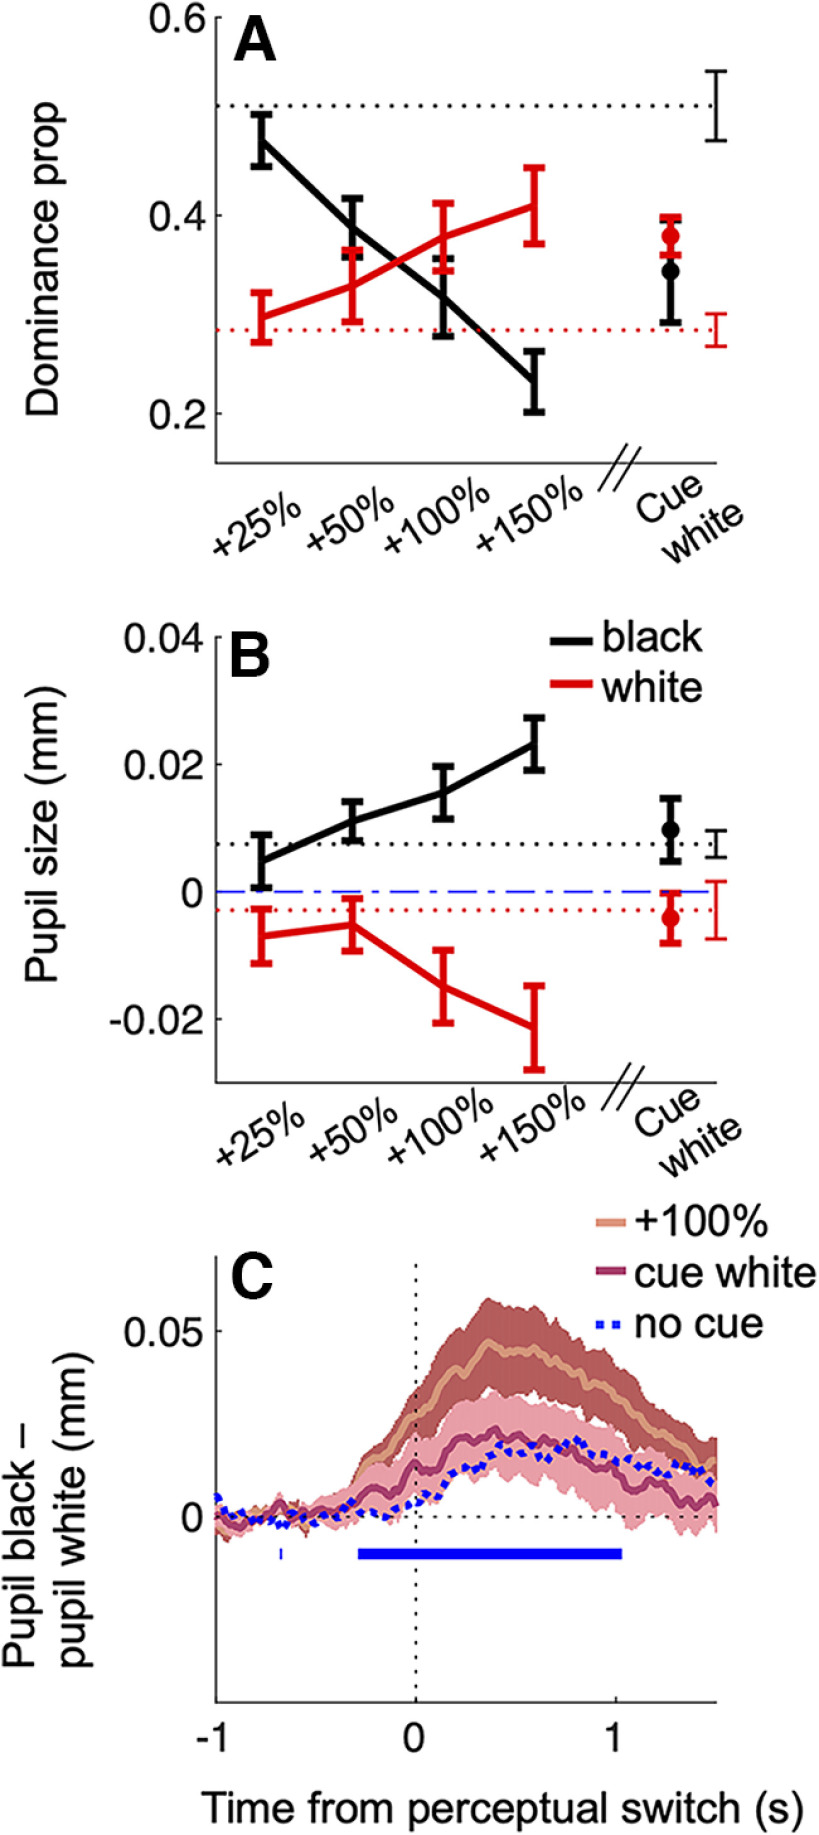
Figure 5.
Effects of attention cueing versus enhancing contrast. A, B, Perceptual dominance for exclusive white or black disk percepts, in the no cue condition (dashed lines) or when the physical contrast of the white disk was enhanced/cued (continuous lines, contrast, or cueing condition indicated on the abscissa). Error bars report ±1 SE across participants. C, Time course of the difference between baseline corrected pupil size during black and white percepts, computed in individual participants and then averaged for each condition. The blue marks on the x-axis highlight time points where pairwise comparisons between the +100% and the no cue condition traces are significant (p < 0.05 FDR corrected). Shadings report mean ±1 SE across participants.

