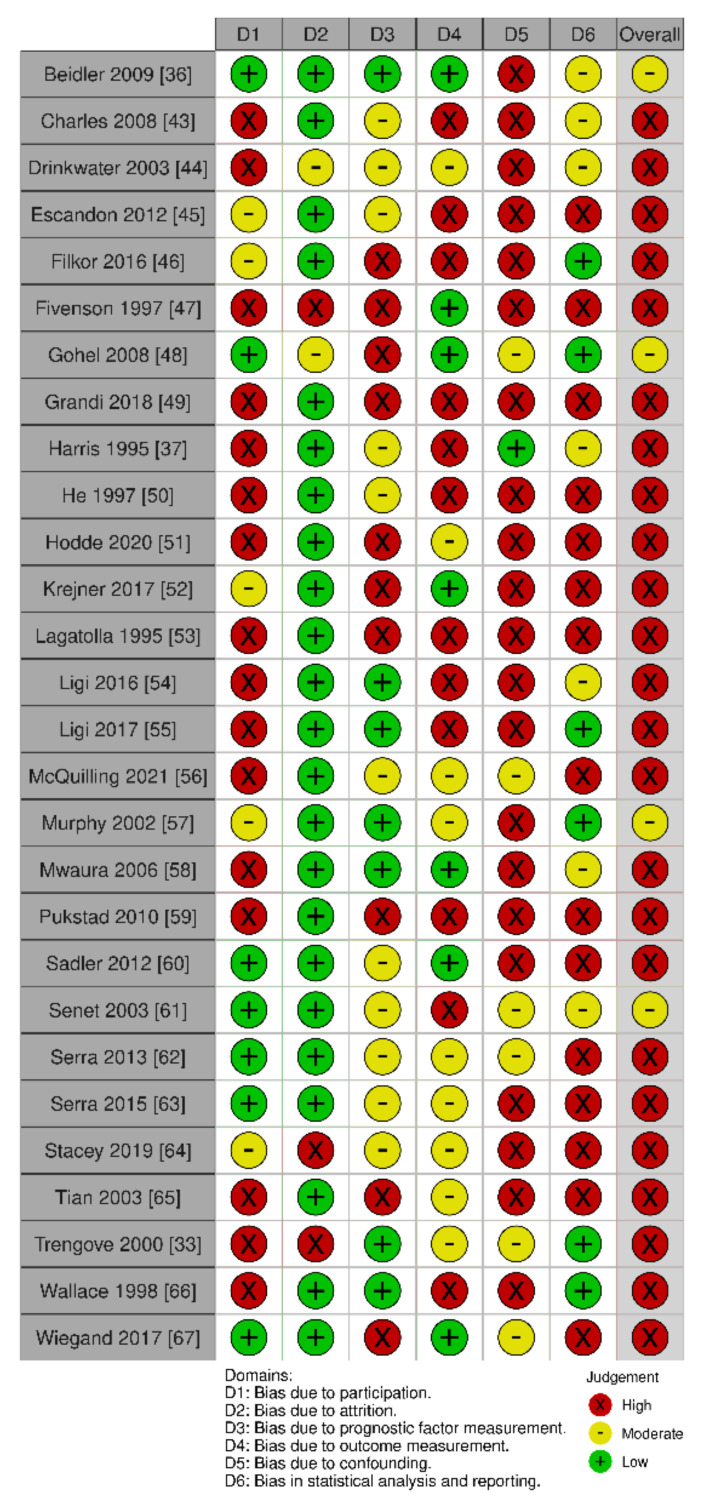
Figure 2.
Quality assessment of the 28 included studies (risk of bias). The individual studies were judged in six domains (D1–D6), and each domain was judged as high, moderate or low risk of bias. An overall rating took all domains into account. The traffic-light plot was created with a tool by McGuinness et al. [70].

