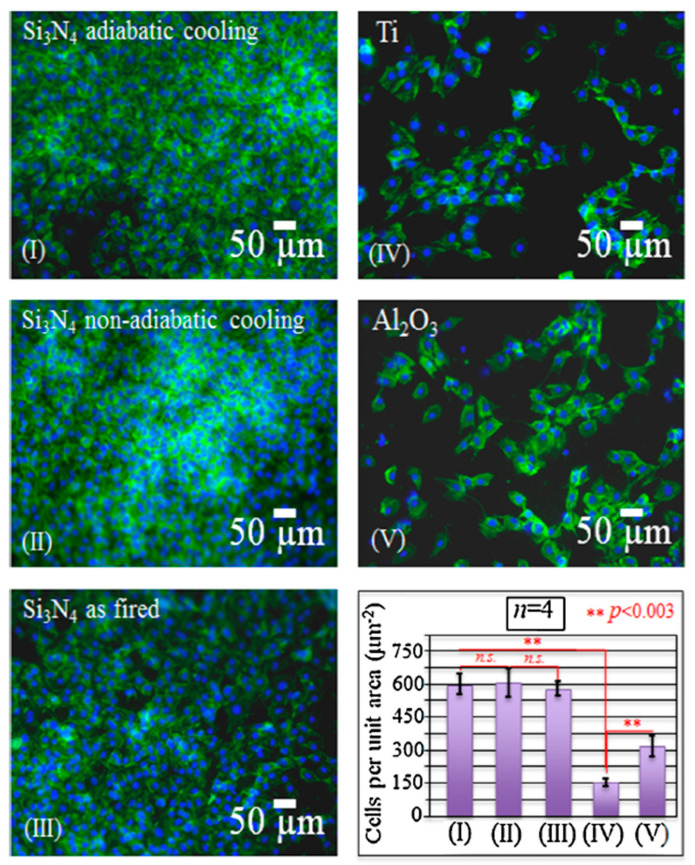
Figure 4.
The fluorescence images of KUSA-A1 cell adhesion on different investigated samples (cf. labeling in inset) and the results of cell counting analyses on different samples (bottom right draft). The numbering in this latter plot corresponds to the numbers shown in each micrograph. The image is reprinted with the permission from ref. [29]. Copyright 2017 Elsevier Publishing Group. n.s.: Not significant.

