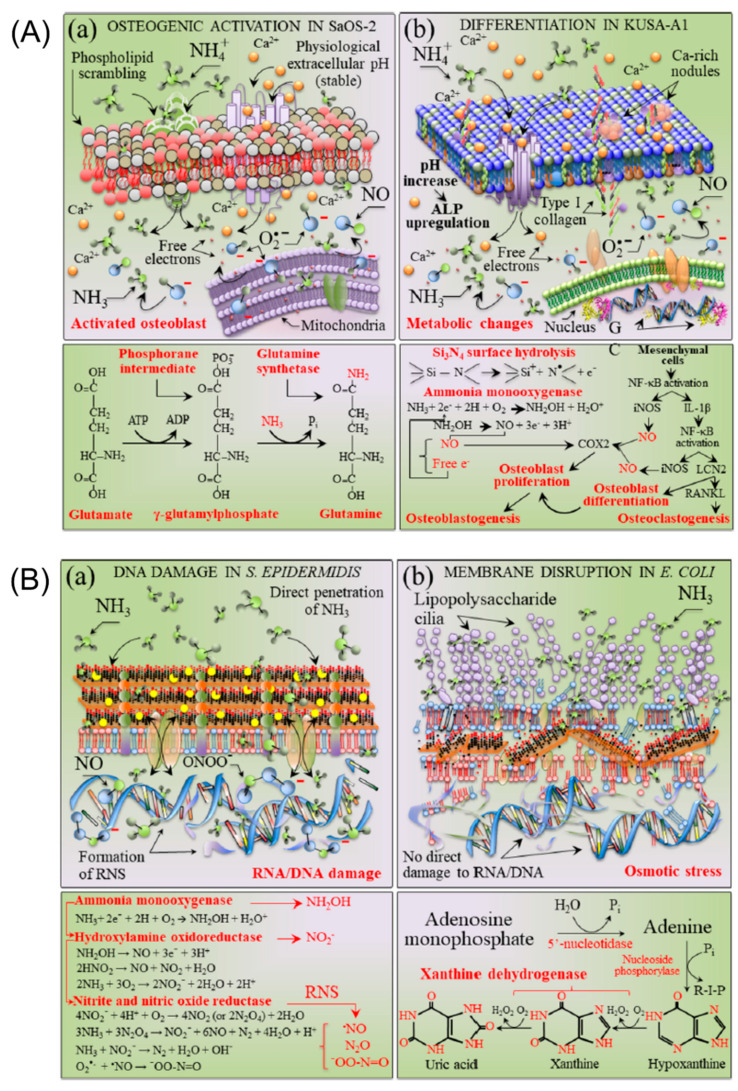
Figure 8.
(A) Schematic diagrams of (a) SaOS-2 and (b) KUSA-A1 cell lines interacting with a Si3N4-activated aqueous environment. At the bottom of the respective draft, the cascade of the main chemical reactions involved with the substrate interaction is shown, which leads to glutamine synthetase and osteoblastogenesis in the (a,b) cases, respectively. In (a), the scrambled plasma membrane phospholipids PS, PC, and PE are drawn in red, brown, and beige colors, respectively, while the mitochondrial membrane is depicted in a uniform violet color. In (b), the nucleus membrane is represented by the green color. (B) Schematic diagrams of (a) S. epidermidis and (b) E. coli bacterial strains interacting with a Si3N4-activated aqueous environment. At the bottom of the respective draft, the cascade of the main chemical reactions involved with the substrate interaction is shown, which leads to direct RNA/DNA damage upon direct penetration of ammonia and membrane disruption by osmotic stress in the (a,b) cases, respectively. The lower panels to the drafts in (a,b) show the main chemical reaction, leading to RNS formation at the S. epidermidis/substrate biomolecular interface and the main path of metabolic stress detected in E. coli on the Si3N4 substrate, respectively. This image is reprinted with permission from ref [114]. Copyright 2019 ACS publishing group.

