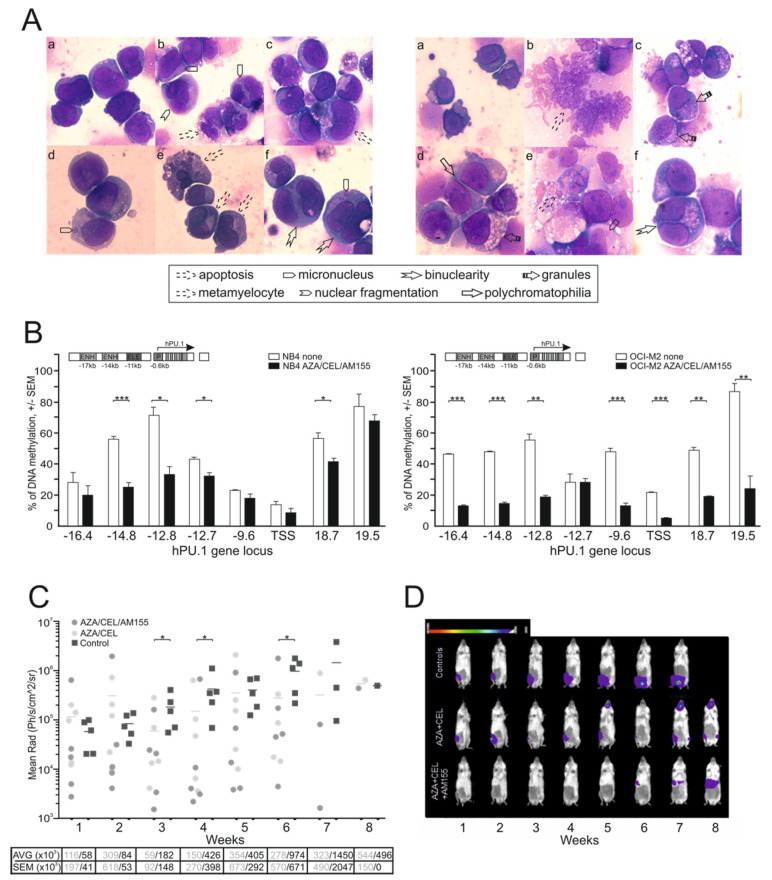
Figure 5.
Evaluating the effects of combined therapy with CEL, AZA, and AM155. (A) Cytology staining via standard May–Grünwald–Giemsa-Romanowski protocol after exposing the hAML cell line NB4 (left) and OCI-M2 cell line (right) for 72 h to 0.4 μM AZA, 0.4 μM CEL, and 4 μM AM155 (b–f) compared to uniform myeloblasts or proerythroblasts respectively seen in untreated (a) controls. (B) DNA methylation of hPU.1 genes, untreated (empty) or treated for 72 h with 0.4 μM AZA, 0.4 μM CEL, and 4 μM AM155 (dark). Methyl DNA IP assay (MagMeDIP), y-axis = %methylation; x-axis = DNA loci. Unpaired two-tailed Student’s t-test was used. Error bars represent standard deviations. (C) Analysis of luciferase activity in mice treated with either 3-drug combination or a vehicle; see Section 2.3. Mean is shown, unpaired Mann–Whitney t-test. Table below provides AVG and SEM values; p-values: * p < 0.05, ** p < 0.05, *** p < 0.005. (D) Examples from the 3 experimental groups (y-axis); luminescence weekly under general anesthesia (isoflurane) after i.p. addition of D-luciferin, see Materials and Methods.

