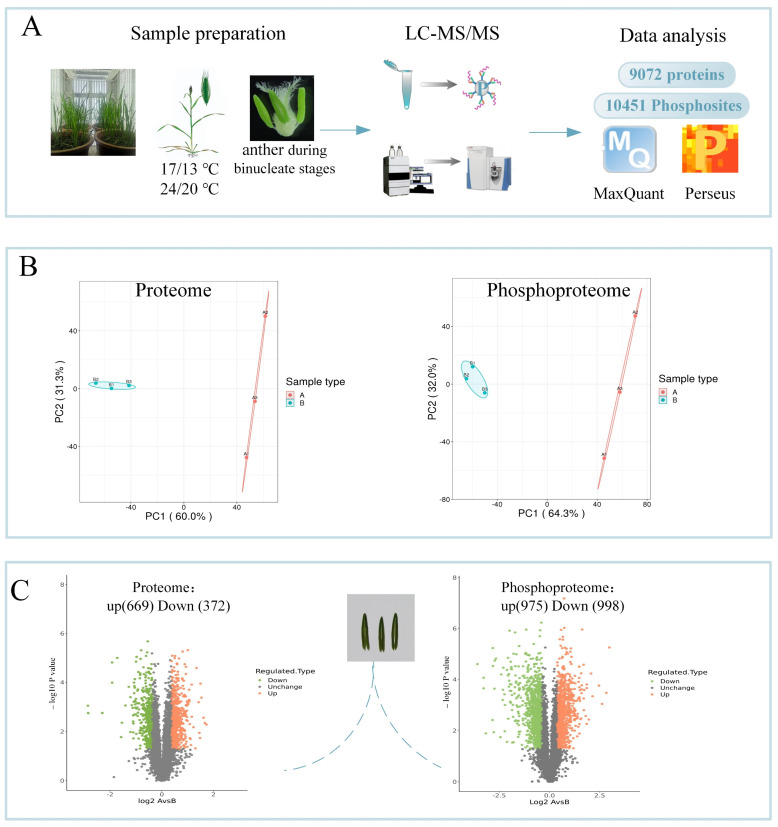
Figure 2.
Experimental strategy. (A) Sample preparation and workflow of the integrated proteomic and phosphoproteomic analyses. (B) Scatter plot of quantitative principal component analysis between repeated samples in the proteome and phosphoproteome data. (C) Up- and down-regulated proteins and phosphosites that were statistically significant are represented in the scatter plots. Each point represents a protein or a phosphosite.

