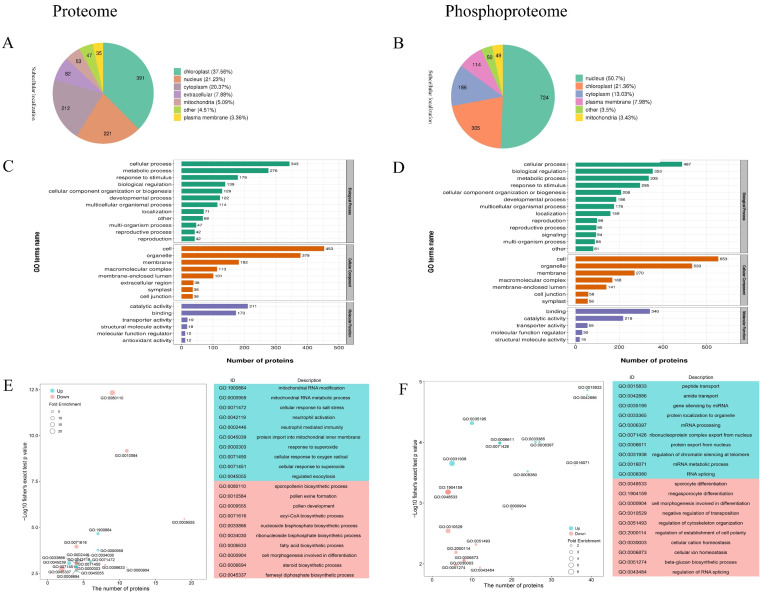
Figure 3.
Analysis of the proteome and phosphoproteome data. Subcellular localization prediction and classification statistics of differentially expressed (A) proteins and (B) phosphosites. GO enrichment analysis of differentially expressed identified enrichment among categories of BP, MF, CC in the proteome (C) and phosphoproteome data (D). GO-BP classification was analyzed for differential protein (E) and phosphoprotein (F) enrichment. The pathway names are shown along the vertical axis, the horizontal axis represents the enrichment factor, the sizes of dots in the pathway represent the number of DAPs, and the p-value is reflected by the color of each dot.

