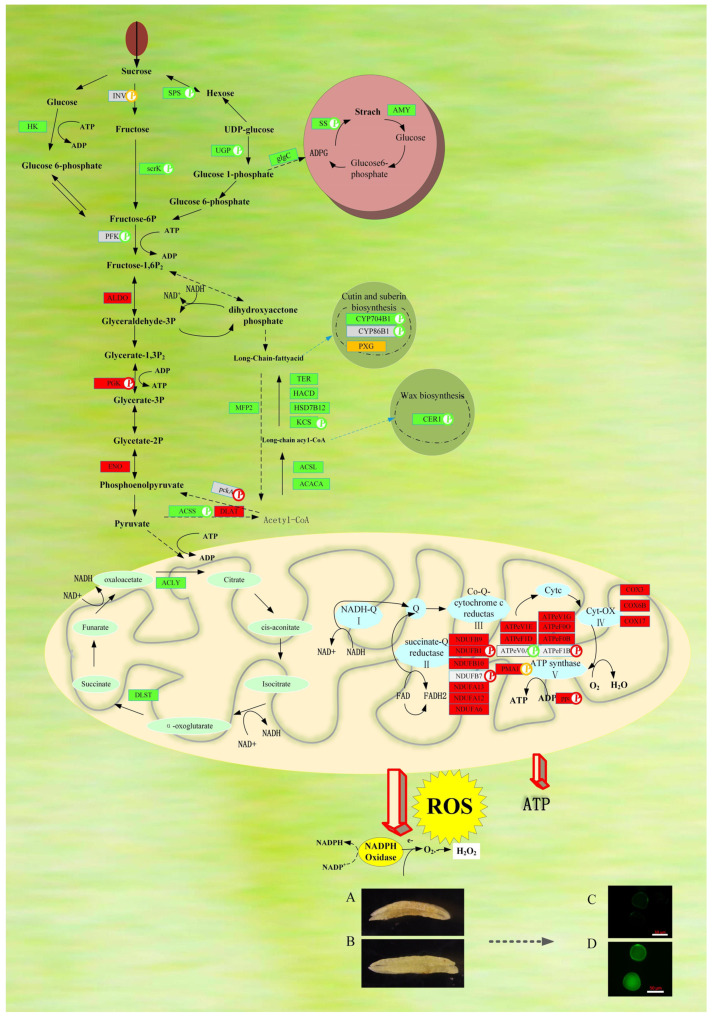
Figure 10.
Schematic overview of the metabolic pathways associated with the differentially expressed proteins identified in pollen abortion of YS3038. DAB staining of (A) YS3038-A and (B) TabYS3038-B. FDA staining of (C) YS3038-A and (D) YS3038-B. Figure is drawn by me using Visio according to our experimental results on the basis Supplementary Materials Tables S4–S6 in article of Wang et al. (2019) [29]. Protein names in gray indicate they were not observed in our proteomic dataset, P in a circle indicates phosphoproteins, green indicates down-regulation, red indicates up-regulation, yellow indicates both up- and down-regulation.

