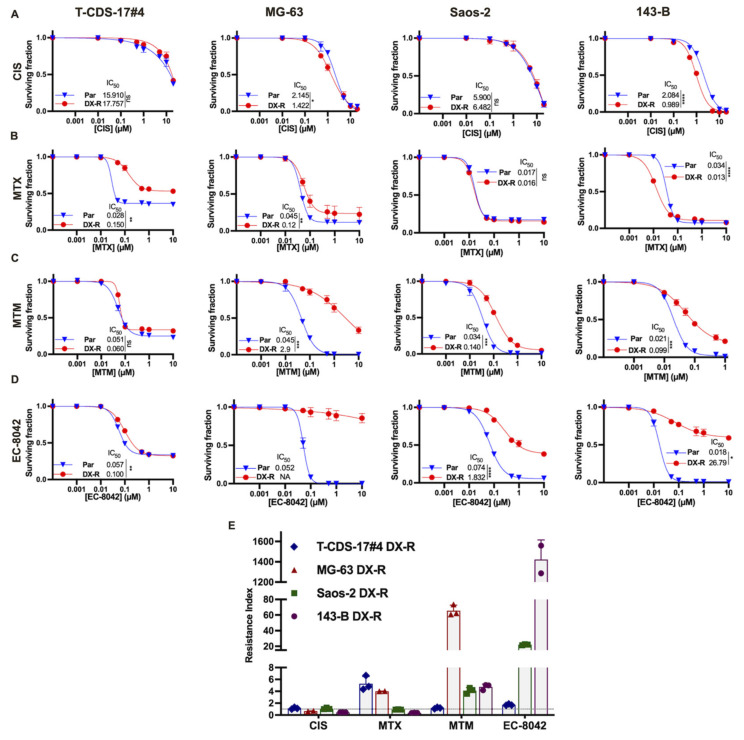
Figure 2.
Cross-resistance of DX-R bone sarcoma cell lines to other chemotherapeutic drugs. (A–D) Cell viability (WST-1 assay) measured after the treatment of parental and DX-R bone sarcoma cell lines with increasing concentrations of cisplatin (CIS) (A), methotrexate (MTX) (B), mithramycin (MTM) (C) and EC-8042 (D) for 72 h. IC50 values (µM) for each condition are shown. Error bars represent the SD. Asterisks indicate statistically significant differences between IC50 concentrations calculated from three independent experiments (ns: p > 0.05; *: p < 0.05; **: p < 0.01; ***: p < 0.001; ****: p < 0.0001; two-sided Student’s t test). (E) Resistance index (RI) for the different drugs calculated as the ratio of the IC50 values of the resistant cells and the corresponding parental cells. The dotted line represents a resistance index of 1, which indicates equal sensitivity in DX-R and parental cells.

