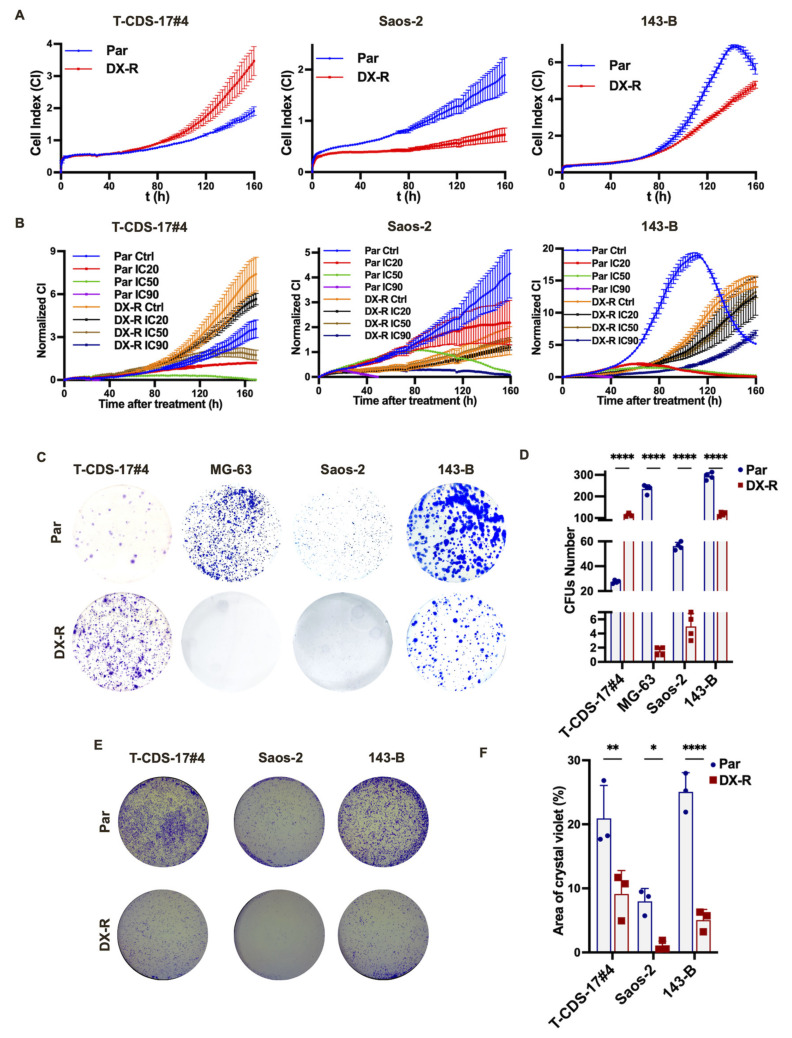
Figure 4.
Proliferative and migration capability of DX-R bone sarcoma cell lines. (A,B) Real-time proliferation analysis (iCELLigence system) of the indicated parental and DX-R cells in the absence (A) or presence of IC20 (8 nM for T-CDS-17#4, 6 nM for Saos-2 and 10 nM for 143-B), IC50 (90 nM for T-CDS-17#4, 37 nM for Saos-2 and 50 nM for 143-B) or IC90 (4600 nM for T-CDS-17#4, 633 nM for Saos-2 and 350 nM for 143-B) concentration of DOX (B). (C,D) Colony formation unit (CFU) assay of parental and DX-R bone sarcoma cell lines. Representative images (C) and quantification of the number of colonies obtained in each case (D) are shown. (E,F) Transwell migration assay of parental and DX-R bone sarcoma cell lines. Representative images (E) and quantification of the surface occupied by migrated cells (F) are shown. Data represent the mean and SD of three independent experiments. Asterisks indicate statistically significant differences between groups in one-way ANOVA test (ns: p > 0.05; *: p < 0.05; **: p < 0.01; ****: p < 0.0001).

