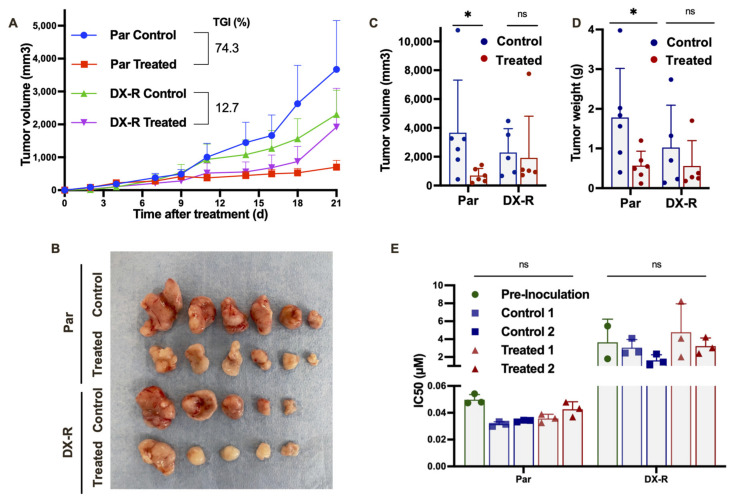
Figure 6.
143-B-DX-R cells maintain resistance in vivo. Mice carrying tumor xenografts generated by parental 143-B or 143-B-DX-R cells were randomly assigned to two different groups (n = 6 per group) and treated i.v. either with saline buffer (control) or DOX at a dose of 4 mg/Kg twice a week (7 doses). (A) Curves representing the mean relative tumor volume of the different groups during the treatments. Drug efficacy is expressed as the percentage of TGI at the end of the experiment. Mean ± SEM is presented. (B) Image of the tumors extracted from the mice at the end of the experiment. (C,D) Distribution of tumor volumes (C) and weights (D) at the end of the experiment. (E) Comparison of the cytotoxic effect of DOX (IC50 values) in parental 143-B and 143-B-DX-R cell lines before (pre-inoculation) and after (post-inoculation) in vivo tumor growth in immunodeficient mice. Error bars represent the SD and asterisks indicate statistically significant differences between groups in one-way ANOVA test (ns: p > 0.05; *: p ≤ 0.05).

