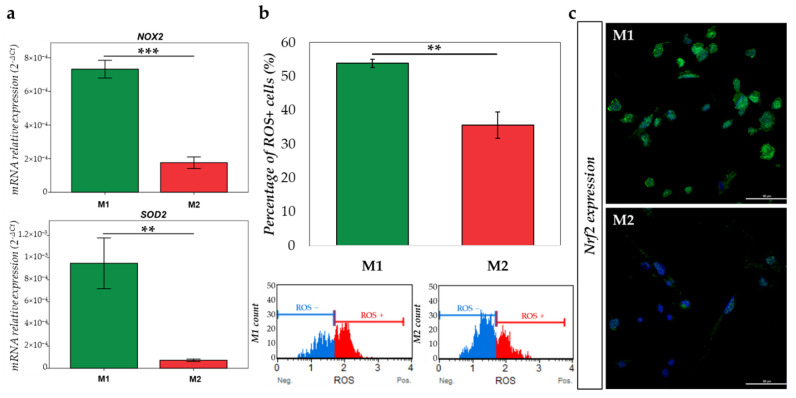
Figure 8.
M1 and M2 oxidative stress comparison. (a) mRNA relative expression (2−ΔCt) of NOX2 and SOD2 involved in the regulation of oxidative stress has been studied by RT-qPCR in M1 (green) and M2 (red) macrophages and normalized with 18S expression; (b) graph representing the percentage of ROS positive in M1 (green) and M2 (red) macrophages, plots show the histogram of gated cells with the 2 populations: ROS(−) (blue) and ROS(+) (red) cells; (c) immunofluorescence of Nrf2 (green) expression in M1 and M2 macrophages. Nuclei were stained with DAPI (blue) (scale = 50 µm). ** = p ≤ 0.01; *** = p ≤ 0.001.

